Old aerial photographs and today in Shiga Prefecture
Select a marker on the map to check the old aerial photograph of that location right there.
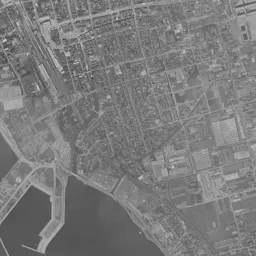
Photographs by era
- 1961-1969: Nagahama Station Area
- 1974-1978: Nagahama Station Area
- 1979-1983: Nagahama Station Area
Station areas in this prefecture that became most built up (top 10)
Ranked by how much the share of built-up area within 500 m of each station grew from 1976 to 2021. The national ranking is in Station areas that became most built up in 45 years.
Urban area share (top: 1976, bottom: 2021)
- 1 Minami-Kusatsu StationJR West Tokaido Line
- 1 Hieizan-Sakamoto StationJR West Kosei Line
- 3 Ritto StationJR West Tokaido Line
- 4 Matsunobamba StationKeihan Electric Railway Ishiyama Sakamoto Line
- 5 Adogawa StationJR West Kosei Line
- 5 Omi-Imazu StationJR West Kosei Line
- 7 Minami-Hikone StationJR West Tokaido Line
- 8 Takatsuki StationJR West Hokuriku Line
- 9 Moriyama StationJR West Tokaido Line
- 10 Kawase StationJR West Tokaido Line
Source: processed from National Land Numerical Information (Land Use Subdivision Mesh / Railway Data / Administrative Boundaries / Ministry of Land, Infrastructure, Transport and Tourism) / Photographs: GSI Tiles (aerial photographs by era / latest nationwide photographs)
See old and today's aerial photographs anywhere in Shiga Prefecture on the map