Imabari (Port and Castle Town) about 60 years ago and today
Then and now
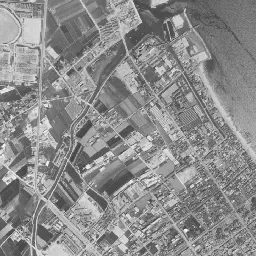
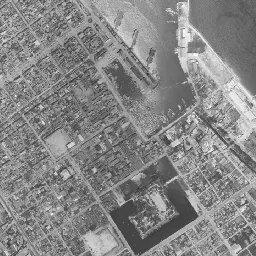
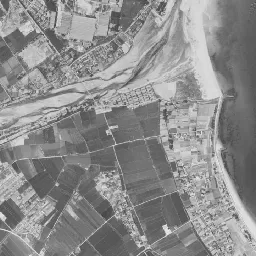
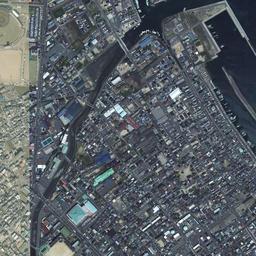
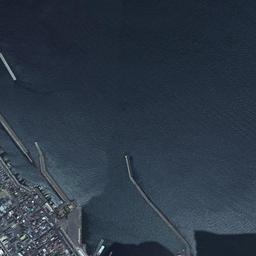
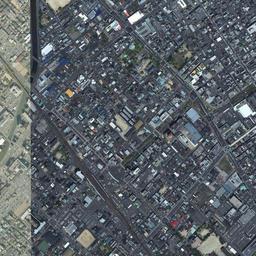
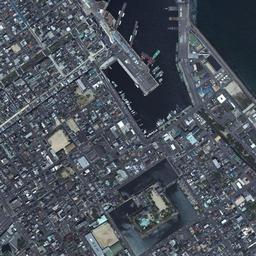
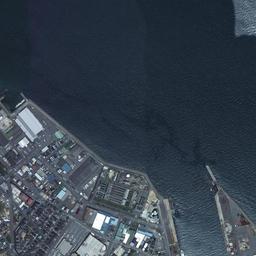
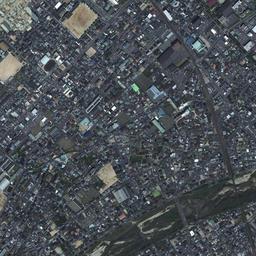
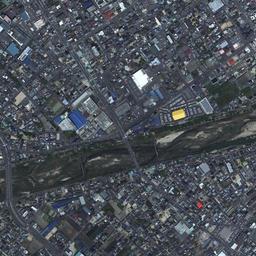
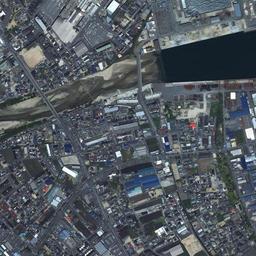

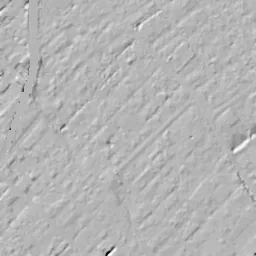
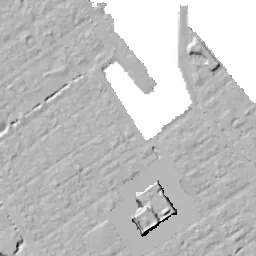
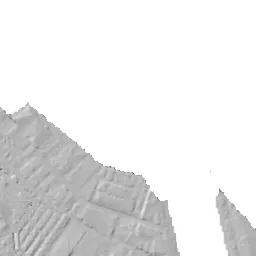
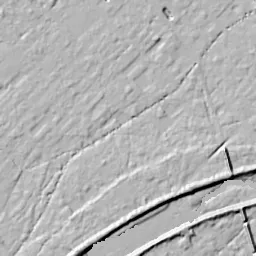


Center photograph taken: 1962-67
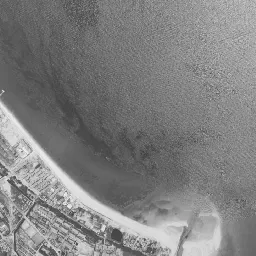
What to compare in this era: A white sandy beach continues from east of the port to the river mouth at the lower right. In the 1974-78 photograph, the same shore has changed into straight seawalls and buildings with white roofs
Controls: drag to move / right-drag to rotate and tilt / scroll while holding ⌘ or Ctrl to zoomControls: slide with two fingers to move / pinch to zoom / drag two fingers up or down to tilt
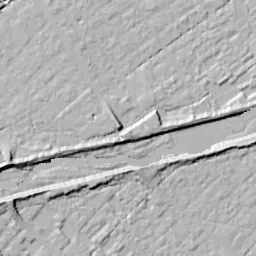
Note: the 3D elevation data is based on current surveys, not on the terrain at the time of the photograph. Elevation tiles: processed from GSI Tiles
The 3D view could not be loaded. Check your connection and try again.
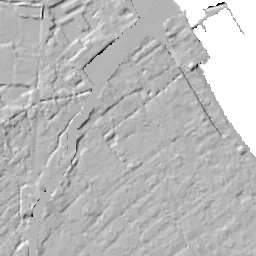
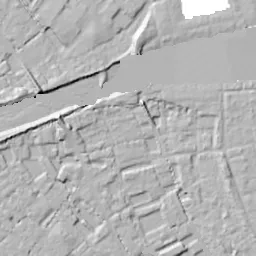
Note: the terrain shading is based on current surveys, not on the terrain at the time of the photograph. Hillshade map: processed from GSI Tiles
Note: the map is today's, not a map from the time of the photograph. Map: © OpenStreetMap contributors
Source: processed from GSI Tiles (aerial photographs by era / latest nationwide photographs / single photographs)
Explore this area on the mapMove the map to compare the surroundings then and now as well.
Overlay and compare the 1961-1969 aerial photograph and today's photograph of the Imabari (Port and Castle Town) area, Ehime Prefecture. All photographs are published by the Geospatial Information Authority of Japan (GSI).
Eras of photographs for this location
For the Imabari (Port and Castle Town) area, aerial photographs from the following eras can be compared.
The old photographs of this location cover 3 eras from 1961-1969 to 1979-1983; as of 2026, the newest photograph, 1979-1983, is 45 years ago.There are no photographs of this location from after that until today. The differences between eras are summarized in the guide to aerial photograph eras.
Coverage for each era differs by region. Only the eras that actually have photographs of this location are listed here.
Elevation of this location
The elevation (above sea level) at the reference point of Imabari (Port and Castle Town) is 2.3 m (source: GSI elevation API). Elevation profiles running east-west and north-south through this location are also shown.
Profile positions (vertical green line = north-south / horizontal blue line = east-west)
Where the line in a profile breaks off and leaves a gap, no elevation data is available (water surfaces such as the sea or rivers).
Elevation is the value at the ground surface (even where a station is underground or elevated, the value is for the ground surface). Elevation is only one factor in disaster preparedness. Check actual risks such as flooding on the Hazard Map Portal Site and the hazard maps published by local governments.
Elevation tiles for the profiles: processed from GSI Tiles
Access by rail
One of the nearest stations to Imabari (Port and Castle Town) is Imabari Station, served by the following lines.
- JR Shikoku Yosan Line
Source of line information: processed from National Land Numerical Information (Railway Data / Ministry of Land, Infrastructure, Transport and Tourism).
Change seen in the share of built-up area
This compares land use in 1976 and 2021. The share of built-up area within 500 m changed from 61% to 64%. Among the locations on this site, the spread of built-up area here is on the small side (bottom 20-40%). The bar below shows where this location falls in the distribution across the locations on this site.
Source: processed from National Land Numerical Information (Land Use Subdivision Mesh / 1976 and 2021 / Ministry of Land, Infrastructure, Transport and Tourism). The texture value (amount of fine detail) of the photographs changed from 17.8 to 38.7. This is a mechanical comparison between photographs and includes differences from the shooting season and from black and white versus color, so treat it only as a rough guide.
Official land prices over time
The official land price (Chika Koji) standard site nearest to this location is "3-1-9 Minamidaimon-cho, Imabari, Ehime Prefecture" (about 1.1 km in a straight line; use: Residential). The official prices per square meter at this standard site from 1983 to 2026 are shown below. The 2026 official price is 67,300 yen.
View as a table
| Year | Official price |
|---|---|
| 1983 | 126,000 yen |
| 1984 | 130,000 yen |
| 1985 | 133,000 yen |
| 1986 | 136,000 yen |
| 1987 | 138,000 yen |
| 1988 | 139,000 yen |
| 1989 | 142,000 yen |
| 1990 | 153,000 yen |
| 1991 | 165,000 yen |
| 1992 | 176,000 yen |
| 1993 | 176,000 yen |
| 1994 | 172,000 yen |
| 1995 | 168,000 yen |
| 1996 | 164,000 yen |
| 1997 | 155,000 yen |
| 1998 | 148,000 yen |
| 1999 | 140,000 yen |
| 2000 | 135,000 yen |
| 2001 | 130,000 yen |
| 2002 | 122,000 yen |
| 2003 | 108,000 yen |
| 2004 | 101,000 yen |
| 2005 | 94,000 yen |
| 2006 | 91,500 yen |
| 2007 | 91,000 yen |
| 2008 | 90,500 yen |
| 2009 | 87,500 yen |
| 2010 | 84,000 yen |
| 2011 | 81,500 yen |
| 2012 | 80,000 yen |
| 2013 | 77,500 yen |
| 2014 | 75,500 yen |
| 2015 | 74,000 yen |
| 2016 | 73,000 yen |
| 2017 | 72,300 yen |
| 2018 | 71,800 yen |
| 2019 | 71,400 yen |
| 2020 | 71,000 yen |
| 2021 | 70,000 yen |
| 2022 | 68,900 yen |
| 2023 | 67,900 yen |
| 2024 | 67,400 yen |
| 2025 | 67,300 yen |
| 2026 | 67,300 yen |
Source: processed from National Land Numerical Information (Land Price Publication Data / Ministry of Land, Infrastructure, Transport and Tourism). Official land prices are values published for standard sites as of January 1 each year and do not show the transaction price of any particular piece of land. The selection and location of standard sites may be reviewed from year to year.
Nearby locations
Sorted by distance from Imabari. Comparing them together shows how the same area has changed over time.
Select a marker on the map to see the location name and a link to it.
Locations with the same origins
Towns in the same category as Imabari (Redevelopment), chosen from other regions. You can compare what they share in land use and town layout.
Select a marker on the map to see the location name and a link to it.
Recently viewed towns
This history is saved only on your device and is not sent to any server. Depending on your browser settings, it may be deleted automatically if you do not visit for a while (it is less likely to be deleted if you use the site as an app).
Why not look at how another town has changed?
History of Imabari (Port and Castle Town)
The center of Imabari is made of the combination of a long, narrow port opening its mouth to the sea and a square moat holding water south of it. These two appear in the middle of the aerial photographs, and the far end of the port is only a few hundred meters from the northern corner of the moat. The daimyo who built the castle placed a town for ships coming and going at the northern corner of the castle, and that arrangement still decides the composition of the photographs more than four hundred years later. The upper right half of the frame is the Seto Inland Sea, the shoreline runs diagonally from upper left to lower right, and at the lower right the Soja River shows a wide riverbed as it reaches the sea.
A flatland castle that drew in the sea
Imabari Castle is a flatland castle built on the coast facing the Seto Inland Sea by Todo Takatora, who gained half of Iyo Province for his service in the Battle of Sekigahara. According to the materials of the City of Imabari, construction began in 1602, and the civil engineering work was finished in 1604. Seawater was drawn into the moats, and the castle had one of the largest boat harbors (funairi) in the country inside it. The origin of the port also lies in this castle. A funairi town where boatmen lived was made at the northern corner of the castle, and in 1831 a breakwater was built to protect the port, after which that area came to be called Tenpozan.
After the Meiji era began, almost all of the castle buildings were torn down, and only the inner moat and the stone walls of the main enclosure remained. The castle site became the first park in the city in 1914. The port, for its part, was long a port for small boats; large ships anchored offshore, and cargo was carried to shore by lighters. Construction of the east breakwater began at the same time as the city's municipal status took effect in 1920, and in 1922 it was designated the first open port in Shikoku. From the following year, a large expansion and improvement was carried out by the state over nine years, and in the work completed in 1934, the breakwater was extended and a landing place and a boat basin in the inner port were prepared. In the downtown damaged in the war, a reconstruction city plan was drawn up in 1946, and the readjustment of streets and lots went ahead. The main enclosure and inner moat of the castle site were designated a prefectural historic site in 1953.
A change in the types of ships made the postwar port busy. In 1959 the first privately run car ferry in the country began service between Imabari and Mihara, and routes to the islands and to Kobe followed. The city's history of the port records that in the first half of the 1960s, the larger size of ships and the rapid increase in cargo and passengers made the inside of the port cramped, and cargo handling was also hindered. It had become difficult for both passengers and cargo to keep using the small port dating from the castle town era.
Until the sandy beach became quays
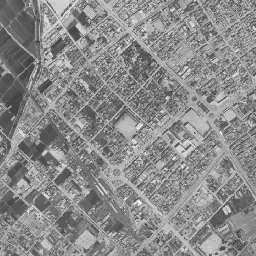
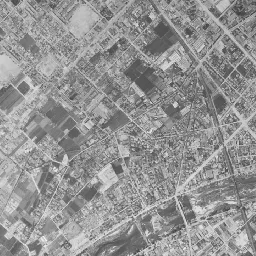
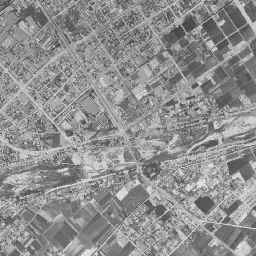
In the 1961-69 black-and-white image, the downtown fills the left half of the frame, leaving almost no vacant land, and straight streets form a grid. The moat in the center appears square as a thick frame of black water, and inside it trees and vacant land remain sparsely. A plaza showing white lies southwest of the moat, and similar square vacant lots are dotted here and there in the downtown. The port on the north side is a water surface cutting narrowly inland, small boats line both banks, and from the east bank a bow-shaped breakwater juts out to the northwest. West of the port, rows of houses extend long and narrow northwest along the shore, unbroken to the upper left edge of the frame. If you move your eye to the right, a white sandy beach continues in a band from east of the port to the mouth of the Soja River, and at the mouth sand has gathered in the shape of a hook. The river flows over a gravel riverbed in many channels, and square paddies and fields spread beyond it at the lower right.
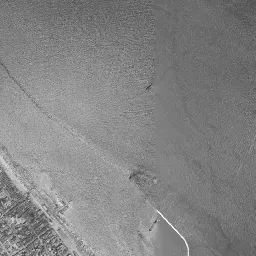
In the 1974-78 image, now in color, the look of the same shore has changed greatly. The sandy beach east of the port has been replaced by reclaimed land with straight seawalls, on which stand many large buildings with white roofs. At the mouth of the Soja River too, the hook-shaped gathering of sand can no longer be seen, and instead straight embankments mark off the water's edge. Northwest of the port mouth, several long, narrow embankments have been added, lined up toward the open sea. In the port's chronology, a detached breakwater 700 m long was completed in 1967. At the top edge of the frame, part of the sea is missing and appears black, and in the upper left corner reclaimed port land and a group of large buildings can be seen. The square of the moat and the grid of the downtown have barely changed since 1961-69.
In the 1979-83 photograph, the sea sinks into deep blue, and even the white wakes of ships passing offshore are captured. On the west bank of the inner port, landing piers line up like the teeth of a comb, and beyond the reclaimed land to the east a long, narrow quay juts out to the north. In the City of Imabari's port chronology, waterfront land preparation in the Zoshiki district at the mouth of the Soja River was completed in 1973, and quays and transit sheds handling cargo were put in place one after another by 1980. It was work to separate passengers and cargo, and in the photographs it can be read as the process of the sandy beach becoming quays. The paddies and fields at the lower right still keep the shape of their lots in this era, but rows of houses are gradually eating into them.
The square of the moat and the mouth of the port
If you switch to today's photograph, the square of the moat and the cut of the port are in the same positions as in the old eras. On the site of the main citadel, buildings and greenery are gathered, and a long, narrow building with a large roof stands on the western quay of the inner port. From 1980 on, the reconstruction of the main keep, turrets and gates went ahead at the castle site, and at the port the Minato Exchange Center was completed in 2015. Outside the port mouth, the long, narrow embankments that appeared in 1974-78 remain in the same line. The reclaimed land to the east is packed with buildings, and many of the paddies and fields at the lower right have turned into housing. The Soja River keeps a riverbed mixed with green as it passes under several bridges to the sea.
Even setting today's photograph beside the photographs from 1961-69 to 1979-83, you can see that the shore side has moved greatly. The inner port shown in 1961-69 is its form after the boat basin was prepared in the improvement up to 1934, and its shape cutting narrowly inland is almost the same in today's photograph. The same goes for the moat; it appears black in the black-and-white era and deep green in the eras in color, but neither the thickness of the frame nor the positions of its four corners change. The large reclamations were carried out along the shore, and the outlines of the castle and the inner port were left as they were.
The orientation of the streets also carries a trace of the castle town. The roads around the moat run parallel to its four sides, and the grid of the downtown follows the shoreline at the same tilt. The skeleton of a town combining a castle and a port has not broken down in any era's photograph after the postwar readjustment of lots. This area is low flat land by the sea, and the east side of the port is also land that was widened by reclamation. Assumptions of storm surge and flooding cannot be read from the photographs, so it is necessary to consult the City of Imabari's hazard map.