Anan (Lower Naka River) about 60 years ago and today
Then and now
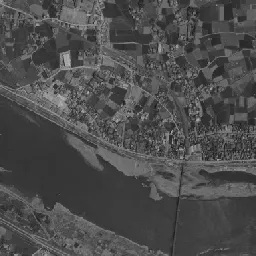
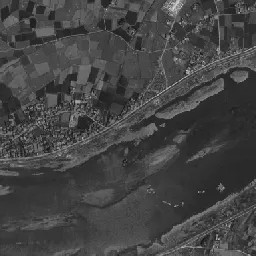
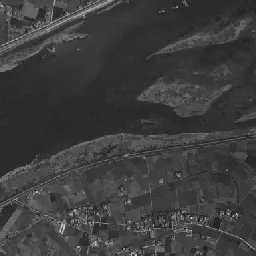
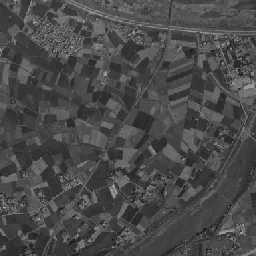
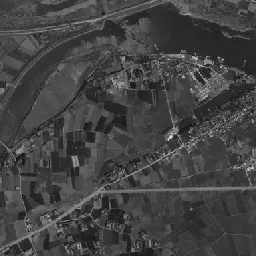
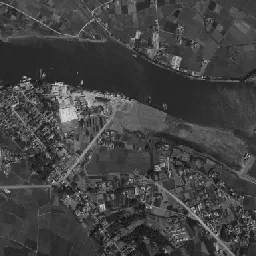
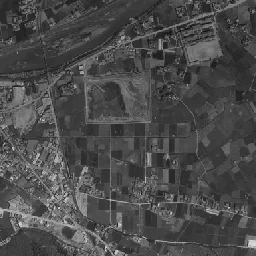
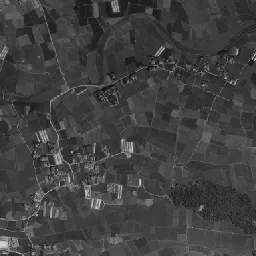
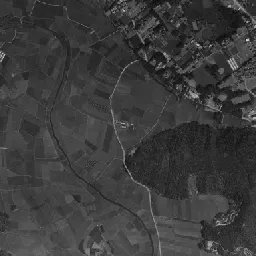
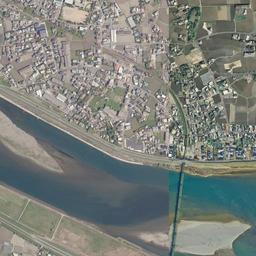
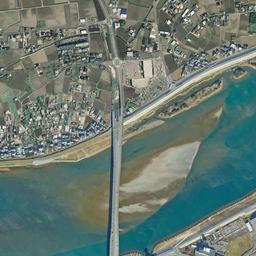
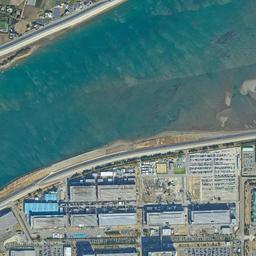
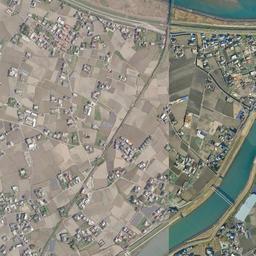
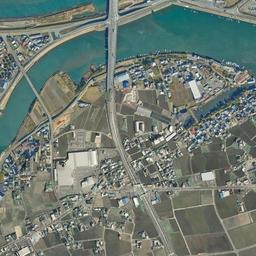
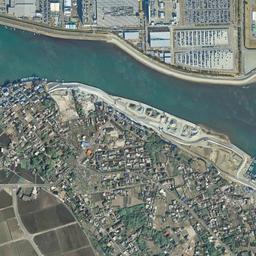
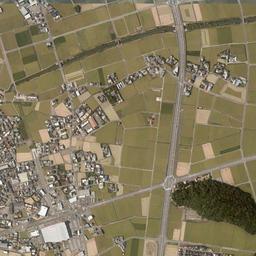
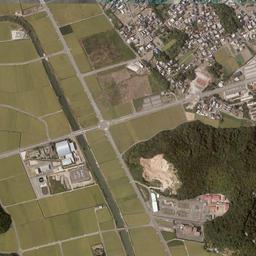


Center photograph taken: 1962-68
What to compare in this era: Paddy lots and houses line up on the land between the two rivers in the upper right. In today's photograph, large factory buildings and parking lots fill it
Controls: drag to move / right-drag to rotate and tilt / scroll while holding ⌘ or Ctrl to zoomControls: slide with two fingers to move / pinch to zoom / drag two fingers up or down to tilt
Note: the 3D elevation data is based on current surveys, not on the terrain at the time of the photograph. Elevation tiles: processed from GSI Tiles
The 3D view could not be loaded. Check your connection and try again.
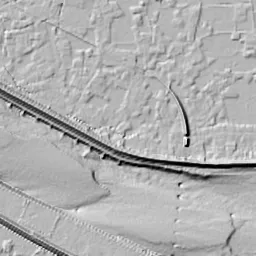
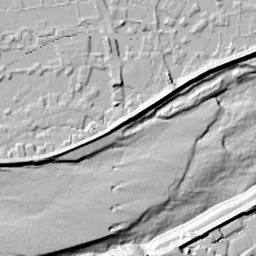
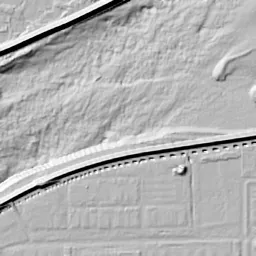
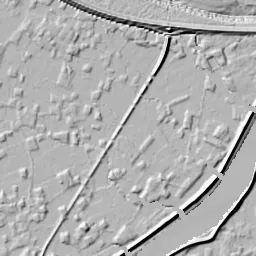
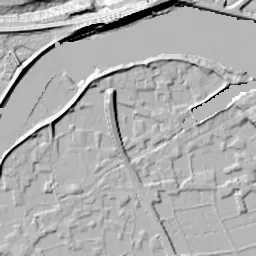
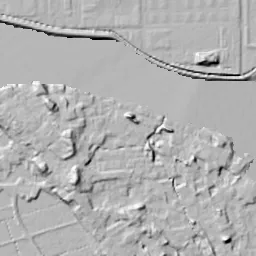
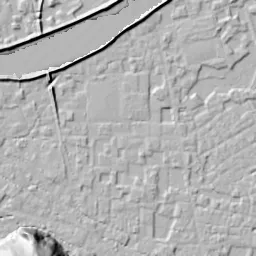
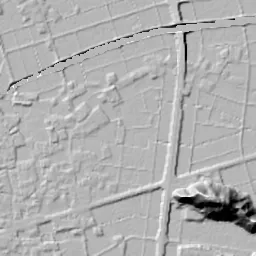
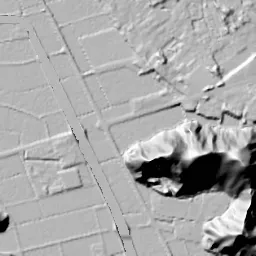
Note: the terrain shading is based on current surveys, not on the terrain at the time of the photograph. Hillshade map: processed from GSI Tiles
Note: the map is today's, not a map from the time of the photograph. Map: © OpenStreetMap contributors
Source: processed from GSI Tiles (aerial photographs by era / latest nationwide photographs / single photographs)
Explore this area on the mapMove the map to compare the surroundings then and now as well.
Overlay and compare the 1961-1969 aerial photograph and today's photograph of the Anan (Lower Naka River) area, Tokushima Prefecture. All photographs are published by the Geospatial Information Authority of Japan (GSI).
Eras of photographs for this location
For the Anan (Lower Naka River) area, aerial photographs from the following eras can be compared.
The old photographs of this location cover 2 eras from 1961-1969 to 1974-1978; as of 2026, the newest photograph, 1974-1978, is 50 years ago.There are no photographs of this location from after that until today. The differences between eras are summarized in the guide to aerial photograph eras.
Coverage for each era differs by region. Only the eras that actually have photographs of this location are listed here.
Elevation of this location
The elevation (above sea level) at the reference point of Anan (Lower Naka River) is 0.8 m (source: GSI elevation API). Elevation profiles running east-west and north-south through this location are also shown.
Profile positions (vertical green line = north-south / horizontal blue line = east-west)
Elevation is the value at the ground surface (even where a station is underground or elevated, the value is for the ground surface). Elevation is only one factor in disaster preparedness. Check actual risks such as flooding on the Hazard Map Portal Site and the hazard maps published by local governments.
Elevation tiles for the profiles: processed from GSI Tiles
Access by rail
One of the nearest stations to Anan (Lower Naka River) is Anan Station, served by the following lines.
- JR Shikoku Mugi Line
Source of line information: processed from National Land Numerical Information (Railway Data / Ministry of Land, Infrastructure, Transport and Tourism).
Change seen in the share of built-up area
This compares land use in 1976 and 2021. The share of built-up area within 500 m changed from 16% to 38%. Among the locations on this site, the spread of built-up area here is in the middle. The bar below shows where this location falls in the distribution across the locations on this site.
Source: processed from National Land Numerical Information (Land Use Subdivision Mesh / 1976 and 2021 / Ministry of Land, Infrastructure, Transport and Tourism). The texture value (amount of fine detail) of the photographs changed from 11.1 to 33. This is a mechanical comparison between photographs and includes differences from the shooting season and from black and white versus color, so treat it only as a rough guide.
Official land prices over time
The official land price (Chika Koji) standard site nearest to this location is "340-6 Nanami-cho Chikuzen, Anan, Tokushima Prefecture" (about 830 m in a straight line; use: Residential). The official prices per square meter at this standard site from 1995 to 2026 are shown below. The 2026 official price is 32,300 yen.
View as a table
| Year | Official price |
|---|---|
| 1995 | 60,000 yen |
| 1996 | 61,000 yen |
| 1997 | 62,000 yen |
| 1998 | 62,500 yen |
| 1999 | 62,900 yen |
| 2000 | 62,900 yen |
| 2001 | 62,700 yen |
| 2002 | 62,400 yen |
| 2003 | 61,200 yen |
| 2004 | 57,500 yen |
| 2005 | 54,000 yen |
| 2006 | 51,000 yen |
| 2007 | 48,800 yen |
| 2008 | 46,700 yen |
| 2009 | 44,800 yen |
| 2010 | 42,300 yen |
| 2011 | 39,700 yen |
| 2012 | 37,000 yen |
| 2013 | 35,000 yen |
| 2014 | 33,800 yen |
| 2015 | 33,400 yen |
| 2016 | 33,100 yen |
| 2017 | 32,900 yen |
| 2018 | 32,700 yen |
| 2019 | 32,600 yen |
| 2020 | 32,600 yen |
| 2021 | 32,400 yen |
| 2022 | 32,300 yen |
| 2023 | 32,300 yen |
| 2024 | 32,300 yen |
| 2025 | 32,300 yen |
| 2026 | 32,300 yen |
Source: processed from National Land Numerical Information (Land Price Publication Data / Ministry of Land, Infrastructure, Transport and Tourism). Official land prices are values published for standard sites as of January 1 each year and do not show the transaction price of any particular piece of land. The selection and location of standard sites may be reviewed from year to year.
Nearby locations
Sorted by distance from Anan. Comparing them together shows how the same area has changed over time.
Select a marker on the map to see the location name and a link to it.
Locations with the same origins
Towns in the same category as Anan (Redevelopment), chosen from other regions. You can compare what they share in land use and town layout.
Select a marker on the map to see the location name and a link to it.
Recently viewed towns
This history is saved only on your device and is not sent to any server. Depending on your browser settings, it may be deleted automatically if you do not visit for a while (it is less likely to be deleted if you use the site as an app).
Why not look at how another town has changed?
History of Anan (Lower Naka River)
Low flat ground between two rivers spreads northeast of Anan Station. The wide Naka River crosses the top of the frame, another river flows just south of it, meandering from the lower left to the right, and the two streams head for the sea beyond the right edge of the frame. The station is in the lower left corner, and the center of the frame lies in the rice paddies some way northeast of it. None of the five elevation points reaches 2 m, and the center is only 0.8 m. It is a river delta close to the sea, and the photographs record the order in which roads, houses and factories came into that land of water and paddies.
Between two rivers
The City of Anan was born on May 1, 1958, when Tomioka Town and Tachibana Town merged and took city status. The city's public newsletter recalls that the city at the time made attracting factories its first pillar in order to rebuild its finances. According to the same article, the city enacted an ordinance to encourage the establishment of factories, attracted companies one after another from the mid-1950s to the mid-1970s, and even drew up a plan to place a large coastal industrial zone along the sea. The city's overview also explains that, in addition to the gifts of the Naka River and the Kii Channel, the manufacturing industries lining the waterfront have supported employment in this city.
At the top edge of the frame, the rows of houses along the north bank of the Naka River belong to the side of the former Nakagawa Town, which was incorporated into the City of Anan on March 20, 2006. The north and south banks, separated by just one river, remained divided into a different city and town even after the City of Anan was born, until 2006. On the south bank side, the old town of Tomioka clustered around the station, and the delta to its northeast long remained rice paddies. The city's overview describes this area as an alluvial plain formed by the Naka River system. It is flat land spreading over sediment carried by the river, and the difference among the five elevation points is only about 1 m. About the only place that could be called high ground is the wooded hill in the lower right corner; everywhere else, paddies at almost the same height as the water surface continue.
The era showing sandbars and boats
The water of the Naka River takes up a good part of the upper half of the frame in the 1961-69 photograph. Many white sandbars float in the stream, and thin bands of sand continue along the banks. In the upper left corner, only one narrow bridge can be seen spanning the river north-south, and from there a single line runs down south toward the station. On the north bank, rows of houses form a band along the river, and on the south bank a straight line runs from left to right, sharply dividing the paddies from the riverbed.
In the middle of the frame, the other river draws an arc from the lower left out to the right, and toward the right on its south bank, rows of houses extend in a long, narrow line along the river. Many small boats line the riverside, suggesting that the river and daily life were close. A single diagonal road runs through the paddies in the center, and another straight east-west road crosses south of it. Houses only stand sparsely along such narrow roads.
The land in the upper right between the two rivers is also, in this era, nothing more than farmland with houses dotted between the paddy lots. In the lower left, roofs are packed around the station, and one wide site enclosed in a square by thin lines can be seen. In the lower right corner, a hill covered with dark woods rises from the flat ground.
In the 1974-78 photograph, part of the water surface shines white, and the outline of the rivers is hard to read in places. Even so, the changes on land are clear. The paddies around the center have become yellow strips divided finely, and just south of them, toward the bottom of the frame, a thin waterway threads through the paddies while bending widely. In the lower left, a sports ground with an oval running track has appeared beside the site that was enclosed in a square.
The land in the upper right between the rivers appears in this era as a wide dark green surface, and the paddy lots that could be read in 1961-69 are unclear. The rows of houses on the south bank continuing toward the right of the frame have grown denser in the same position as in the previous era, and rows of boats still remain along the riverside. In a corner just north of the center, hugging the south bank of the river, buildings with white roofs have increased in number, and houses have begun to line the road extending south from there. From this era it can be read that the hamlets that followed the riverbank had begun to spread toward the paddies.
Factories downstream and a new bridge
In today's photograph, the land in the upper right between the two rivers has changed most. Large buildings with white and blue roofs line up like a grid, with wide parking lots filling the space between them. This area is where Nichia Corporation has its Tatsumi Plant, which makes LEDs and phosphors. In the photograph, the land of paddies and houses has been replaced by one continuous factory site. A wide water surface remains south of the factory, and on the south bank beyond it, a white embankment line now edges the rows of houses in an arc.
Across the Naka River, in the middle of the upper half of the frame, there is a bridge that was not there in the black-and-white era, linking the former Nakagawa Town on the north bank with the south bank. The road across the bridge runs north-south just west of the center, and large flat-roofed buildings have come to line it. In paddies that had only a few narrow roads in 1961-69, a broad road for cars has come through. The narrow bridge in the upper left corner remains in the same position as in the black-and-white era, and with the new bridge added to its east, there are now two routes across the Naka River within the frame alone. The road running south from the new bridge also crosses the other river in succession north of the center.
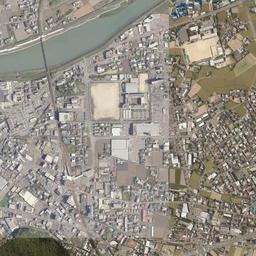
Even so, in the lower part of the frame south of the center, rice paddies remain together. The lots are larger and more regular than the strips of 1974-78, and traces of the bending waterway can also be followed as a thin line. The wooded hill in the lower right keeps almost the same outline as in the black-and-white era, but a facility with white roofs stands at its foot, and bare soil shows on part of the slope. Around the station in the lower left, roofs have increased, and lots with paddies can hardly be seen. Factories, roads and paddies lined up on the delta: that is how it looks today.
It is a delta at about 1 m above sea level, and to know the assumed flooding and storm surge, looking up the address on the local government's hazard map is reliable. In Nanami-cho, about 830 m from the location, there is a standard residential site for official land prices (Chika Koji); up to the 2026 publication, the highest was 62,900 yen per square meter in 1999 and 2000, and the lowest was 32,300 yen in 2022, 2023, 2024, 2025 and 2026.