Tsudanuma about 60 years ago and today
Then and now
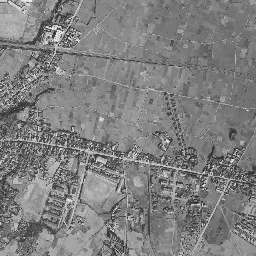
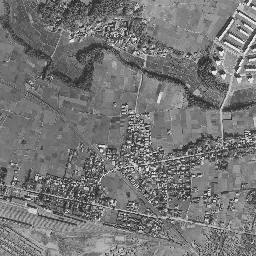
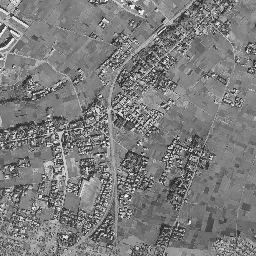
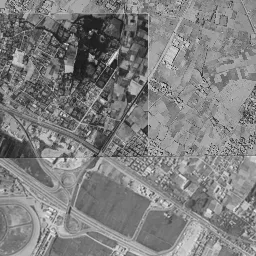
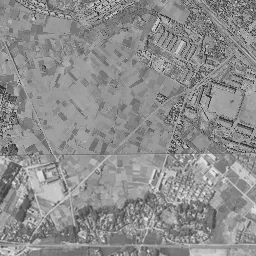
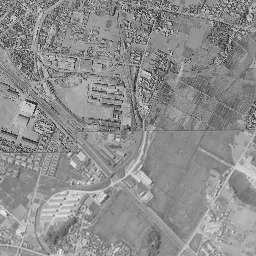
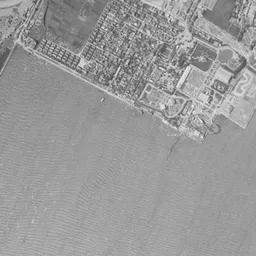
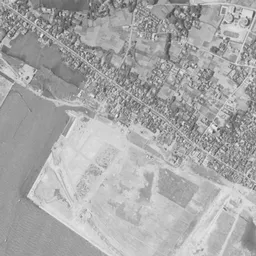
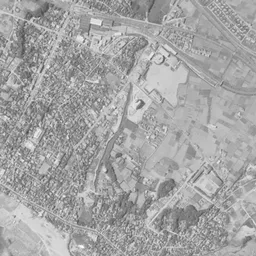
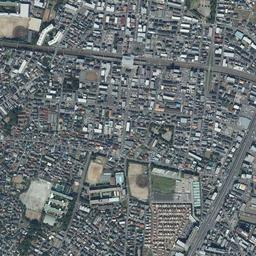
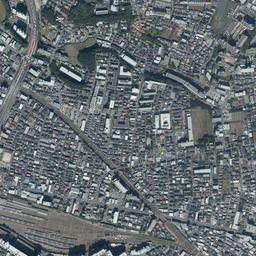
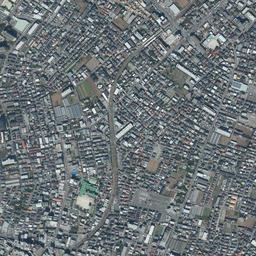
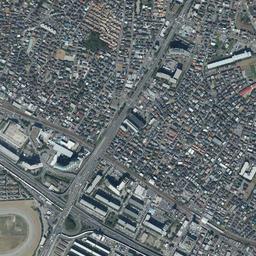
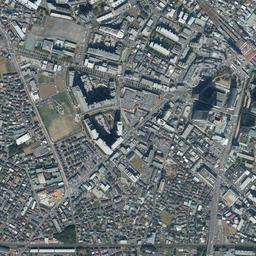
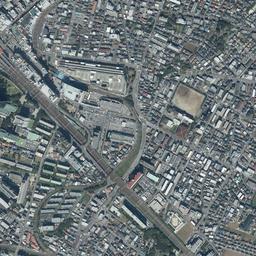
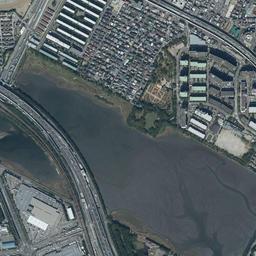
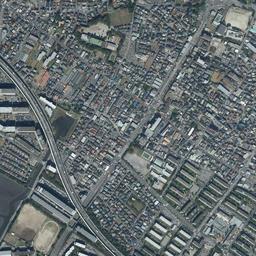
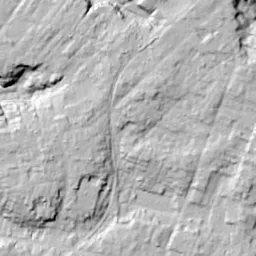
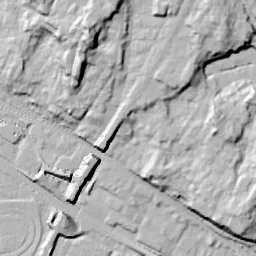
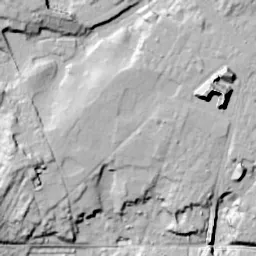
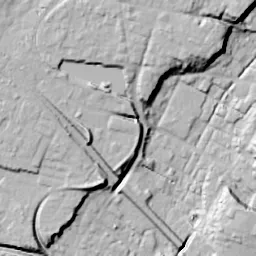


Center photograph taken: 1961-66
What to compare in this era: A white, flat square surface appears in the middle of the bottom edge. If you go back to 1945-50, the same position is sea
Controls: drag to move / right-drag to rotate and tilt / scroll while holding ⌘ or Ctrl to zoomControls: slide with two fingers to move / pinch to zoom / drag two fingers up or down to tilt
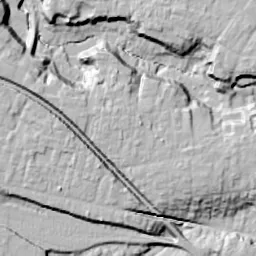
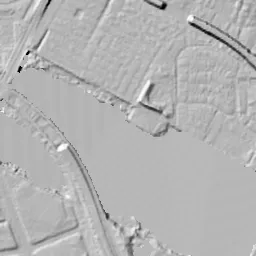
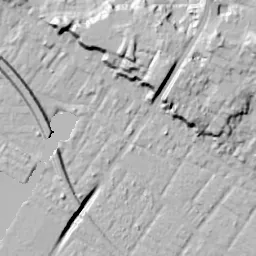
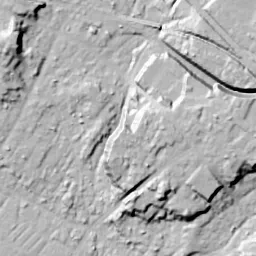
This 3D terrain is today's. The mismatch when you overlay an old photograph is the evidence of the land development that cut hills and filled valleys.
Note: the 3D elevation data is based on current surveys, not on the terrain at the time of the photograph. Elevation tiles: processed from GSI Tiles
The 3D view could not be loaded. Check your connection and try again.
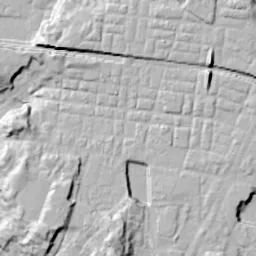
Note: the terrain shading is based on current surveys, not on the terrain at the time of the photograph. Hillshade map: processed from GSI Tiles
Note: the map is today's, not a map from the time of the photograph. Map: © OpenStreetMap contributors
Source: processed from GSI Tiles (aerial photographs by era / latest nationwide photographs / single photographs)
Explore this area on the mapMove the map to compare the surroundings then and now as well.
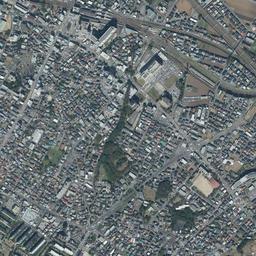
Overlay and compare the 1961-1969 aerial photograph and today's photograph of the Tsudanuma area, Chiba Prefecture. All photographs are published by the Geospatial Information Authority of Japan (GSI).
Eras of photographs for this location
For the Tsudanuma area, aerial photographs from the following eras can be compared.
The old photographs of this location cover 6 eras from 1945-1950 to 1987-1990; as of 2026, the newest photograph, 1987-1990, is 37 years ago.There are no photographs of this location from after that until today. The differences between eras are summarized in the guide to aerial photograph eras.
Coverage for each era differs by region. Only the eras that actually have photographs of this location are listed here.
Elevation of this location
The elevation (above sea level) near Tsudanuma Station is 16.1 m (source: GSI elevation API). Elevation profiles running east-west and north-south through this location are also shown.
Profile positions (vertical green line = north-south / horizontal blue line = east-west)
Elevation is the value at the ground surface (even where a station is underground or elevated, the value is for the ground surface). Elevation is only one factor in disaster preparedness. Check actual risks such as flooding on the Hazard Map Portal Site and the hazard maps published by local governments.
Elevation tiles for the profiles: processed from GSI Tiles
Access by rail
Tsudanuma Station is served by the following lines.
- JR East Sobu Line
Source of line information: processed from National Land Numerical Information (Railway Data / Ministry of Land, Infrastructure, Transport and Tourism).
Change seen in the share of built-up area
This compares land use in 1976 and 2021. The share of built-up area within 500 m changed from 68% to 96%. Among the locations on this site, the spread of built-up area here is on the large side (top 20-40%). The bar below shows where this location falls in the distribution across the locations on this site.
Source: processed from National Land Numerical Information (Land Use Subdivision Mesh / 1976 and 2021 / Ministry of Land, Infrastructure, Transport and Tourism). The texture value (amount of fine detail) of the photographs changed from 13.6 to 40. This is a mechanical comparison between photographs and includes differences from the shooting season and from black and white versus color, so treat it only as a rough guide.
Official land prices over time
The official land price (Chika Koji) standard site nearest to this location is "2-265-6 Maebara-nishi, Funabashi, Chiba Prefecture" (about 428 m in a straight line; use: Residential). The official prices per square meter at this standard site from 1983 to 2026 are shown below. The 2026 official price is 342,000 yen.
View as a table
| Year | Official price |
|---|---|
| 1983 | 180,000 yen |
| 1984 | 183,000 yen |
| 1985 | 185,000 yen |
| 1986 | 189,000 yen |
| 1987 | 207,000 yen |
| 1988 | 450,000 yen |
| 1989 | 450,000 yen |
| 1990 | 510,000 yen |
| 1991 | 559,000 yen |
| 1992 | 475,000 yen |
| 1993 | 405,000 yen |
| 1994 | 380,000 yen |
| 1995 | 369,000 yen |
| 1996 | 330,000 yen |
| 1997 | 300,000 yen |
| 1998 | 290,000 yen |
| 1999 | 260,000 yen |
| 2000 | 237,000 yen |
| 2001 | 226,000 yen |
| 2002 | 215,000 yen |
| 2003 | 207,000 yen |
| 2004 | 200,000 yen |
| 2005 | 198,000 yen |
| 2006 | 205,000 yen |
| 2007 | 225,000 yen |
| 2008 | 252,000 yen |
| 2009 | 233,000 yen |
| 2010 | 228,000 yen |
| 2011 | 227,000 yen |
| 2012 | 224,000 yen |
| 2013 | 224,000 yen |
| 2014 | 228,000 yen |
| 2015 | 237,000 yen |
| 2016 | 242,000 yen |
| 2017 | 248,000 yen |
| 2018 | 255,000 yen |
| 2019 | 259,000 yen |
| 2020 | 270,000 yen |
| 2021 | 275,000 yen |
| 2022 | 282,000 yen |
| 2023 | 300,000 yen |
| 2024 | 313,000 yen |
| 2025 | 338,000 yen |
| 2026 | 342,000 yen |
Source: processed from National Land Numerical Information (Land Price Publication Data / Ministry of Land, Infrastructure, Transport and Tourism). Official land prices are values published for standard sites as of January 1 each year and do not show the transaction price of any particular piece of land. The selection and location of standard sites may be reviewed from year to year.
Nearby locations
Sorted by distance from Tsudanuma. Comparing them together shows how the same area has changed over time.
Select a marker on the map to see the location name and a link to it.
Locations with the same origins
Towns in the same category as Tsudanuma (New town), chosen from other regions. You can compare what they share in land use and town layout.
Select a marker on the map to see the location name and a link to it.
Recently viewed towns
This history is saved only on your device and is not sent to any server. Depending on your browser settings, it may be deleted automatically if you do not visit for a while (it is less likely to be deleted if you use the site as an app).
Why not look at how another town has changed?
History of Tsudanuma
A section where high-rise residential buildings, a grid of streets and lawn plazas come together spreads south of Tsudanuma Station. This town, called Kanadenomori, was born from a land readjustment that an association of landowners carried out from 2007. If you line up the aerial photographs from the oldest, a mass of fields just southwest of the station keeps remaining until the end of the 1980s, and while the surroundings fill with housing, that part alone appears still under cultivation. The new town was assembled all at once on top of those fields. The area covers parts of each of Yatsu 1-chome, 5-chome, 6-chome and 7-chome in the City of Narashino, and it is about 35 hectares.
Between the tracks and the tidal flats
The town of Tsudanuma took shape together with the railway. In 1895 Tsudanuma Station of the Sobu Railway opened, and in 1907 the army's Railway Battalion was stationed here, later becoming the 2nd Railway Regiment. In 1921 the Keisei Line was opened from Funabashi to Chiba, and Yatsu-kaigan Station and Keisei-Tsudanuma Station opened. The form of two lines of track running side by side over the plateau facing the sea was fixed at this time.
In the 1945-50 photograph part of the upper side is missing, but the scene south of the station can be read. Tracks running from northwest to southeast form a bundle at the station, and lines branching off from there extend west. Northeast of the station, rows of houses are packed densely, and next to it on the west there is a corner where white buildings of the same shape line up facing the same way. From the center to the west, small fields divided into strips and squares continue everywhere. A band of black woods crosses east-west along their southern end. It seems to be woods remaining on the slope at the edge of the plateau, and below the band another line of track runs alongside. Further south, at the bottom edge of the frame, white shining sand and water spread. This is the shallow coast that continued into the inner part of Tokyo Bay.
Fields that turned their back on the reclamation
Change begins from the sea side in the 1961-69 photograph. In the middle of the bottom edge a white, flat square surface appears, and its shape shows that it is land made by filling in the sea. In the City of Narashino, the first reclamation went ahead from the mid-1960s to the mid-1970s and the second from the mid-1970s to the mid-1980s, and residential areas were developed on them. On the land side, large buildings increase around the station, and toward the top residential buildings of the same shape line up. At the left edge a wide road appears, crossing in an arc. In the 1960s the Keiyo Road had been opened from Funabashi to Yatsu, and this seems to be part of it. Yet the fields southwest of the station have hardly changed in the shape or size of their lots from 1945-50. The woods surrounding homesteads and the band of woods at the southern end also appear black in the same places.
In the 1974-78 photograph, residential areas of small roofs surround the fields, and a tall building stands southeast of the station. The fields form a mass close to a triangle, keeping their green and brown lots as they were. The left half was taken at a different time and appears bluish. In the lower left corner a dark water surface remains in a square. This is the Yatsu Tidal Flat, left as a remnant of the sea while the reclamation around it went ahead; it is about 40 hectares and almost rectangular in shape. In 1993 it became the first tidal flat in Japan to be registered as a wetland under the Ramsar Convention.
In the 1979-83 and 1984-86 photographs too, the mass of fields remains without changing its outline. On the brown surface surrounded on all sides by roads, a single white rectangle is mixed in, and that is all. Large buildings increase north and south of the station, and beside the tidal flat at the lower left an elevated road appears in an arc. In 1984-86, a wide station yard with many tracks laid in parallel can be seen northwest of the station, and in the middle of the left edge a shape like an oval ring appears. In the 1987-90 photograph too, the fields still have the same shape. The lots that were brown have sunk into dark green, and only the thin lines of the ridges between them stand out white. At the north exit of the station, a land readjustment of about 12 hectares carried out by Chiba Prefecture continued from 1970 to 1995. This means that between the north and south of the station there was a time lag of more than 30 years in remaking the town. The City of Narashino gives as the reason for the project that small-scale development had begun within the area, and if left as it was, unified improvement including roads and parks would become difficult.
An ancient village dug up
The founding of the association was approved in July 2007. Alongside the land readjustment, a full excavation of the Yatsu Shell Mound was carried out from fiscal 2007 to fiscal 2013. It is a site centered on the plateau on the south side of the station, and the remains of a key settlement from the end of the 7th century to the first half of the 10th century were found. The remains of pit dwellings number more than 400. Farming and fishing are thought to have been carried on here on top of the plateau facing the sea. In the second half of the 9th century, when the settlement reached its peak, a group of large post-built buildings with smithing workshops is said to have stood in rows. This means that a village more than a thousand years old lay sleeping under the land left as fields.
The work advanced to the point where use of the land began over almost the whole area at the end of March 2014, and the replotting disposition was publicly announced on August 21, 2015. In April 2016, use of Yatsu Kanadenomori Park, about 2.2 hectares, began. The planned population is about 7,000, a scale that welcomes as many residents as a whole town onto land that was fields. The goal the plan set out is a park city where people can enjoy walking through a town of greenery and flowers. Commerce was placed on the side near the station, high-rise and mid-rise housing outside it, and low-rise housing and consolidated farmland further out, and the First Junior High School, its grounds put in order, was also relocated within this area.
The grid of the park city
Where the brown lots once lined up, in today's photograph many high-rise residential buildings stand, and streets close to a grid divide the spaces between them. Fine shadows intertwine at the feet of the buildings, which look like one continuous mass with the large buildings in front of the station. Toward the west there is a green rectangular plaza, which seems to be a park. The tidal flat at the lower left holds water with the same rectangular outline as in 1974-78, and along its northern shore many rows of white, long, narrow residential buildings line up in parallel. The flooding assumptions for the reclaimed land and the low land next to the tidal flat are shown on the hazard maps of the City of Narashino and the City of Funabashi.