Kashima Coastal Industrial Zone about 60 years ago and today
Then and now
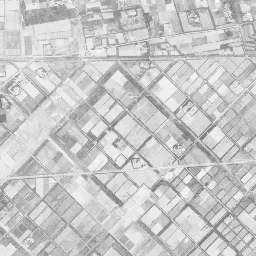
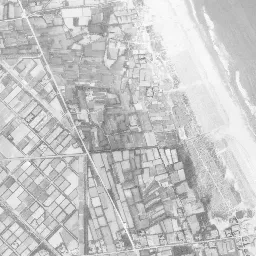
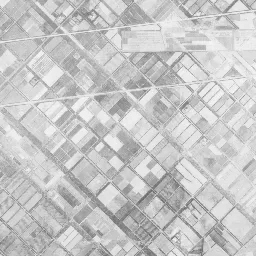
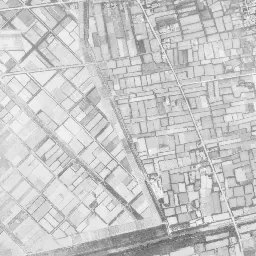
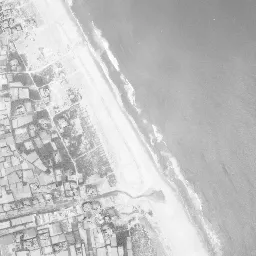
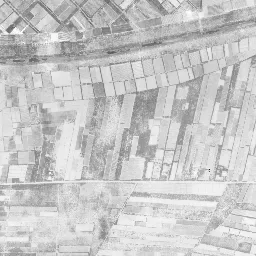
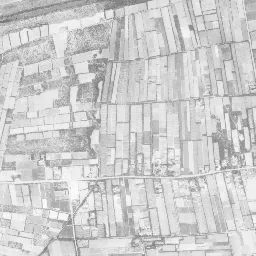
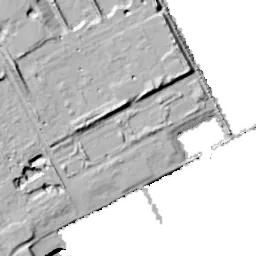
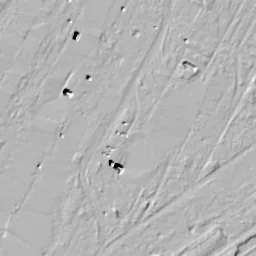
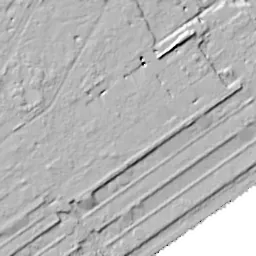
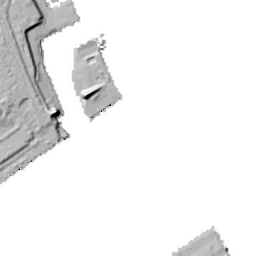


Nearby single photograph taken: October 24, 1965 (0.5 km from this spot)
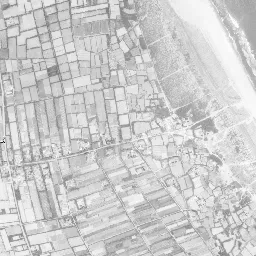
What to compare in this era: Look at the land side. It is fields from corner to corner, and nearer the sea long, narrow strips line up irregularly
Controls: drag to move / right-drag to rotate and tilt / scroll while holding ⌘ or Ctrl to zoomControls: slide with two fingers to move / pinch to zoom / drag two fingers up or down to tilt
Note: the 3D elevation data is based on current surveys, not on the terrain at the time of the photograph. Elevation tiles: processed from GSI Tiles
The 3D view could not be loaded. Check your connection and try again.
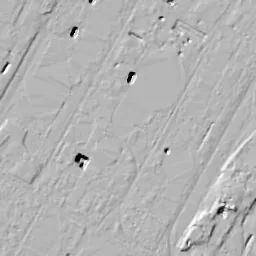
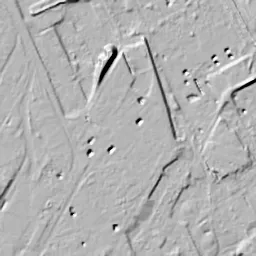
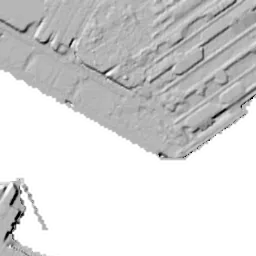
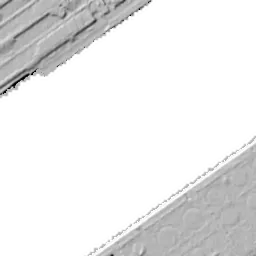
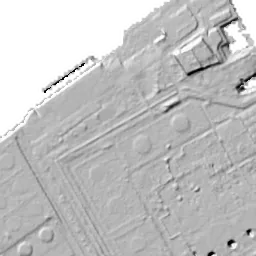
Note: the terrain shading is based on current surveys, not on the terrain at the time of the photograph. Hillshade map: processed from GSI Tiles
Note: the map is today's, not a map from the time of the photograph. Map: © OpenStreetMap contributors
Source: processed from GSI Tiles (aerial photographs by era / latest nationwide photographs / single photographs)
Explore this area on the mapMove the map to compare the surroundings then and now as well.
Overlay and compare the 1961-1969 aerial photograph and today's photograph of the Kashima Coastal Industrial Zone area, Ibaraki Prefecture. All photographs are published by the Geospatial Information Authority of Japan (GSI).
Eras of photographs for this location
For the Kashima Coastal Industrial Zone area, aerial photographs from the following eras can be compared.
The old photographs of this location cover 4 eras from 1961-1969 to 1984-1986; as of 2026, the newest photograph, 1984-1986, is 42 years ago.There are no photographs of this location from after that until today. The differences between eras are summarized in the guide to aerial photograph eras.
Coverage for each era differs by region. Only the eras that actually have photographs of this location are listed here.
Elevation of this location
The elevation (above sea level) at the reference point of Kashima Coastal Industrial Zone is 8.1 m (source: GSI elevation API). Elevation profiles running east-west and north-south through this location are also shown.
Profile positions (vertical green line = north-south / horizontal blue line = east-west)
Where the line in a profile breaks off and leaves a gap, no elevation data is available (water surfaces such as the sea or rivers).
Elevation is the value at the ground surface (even where a station is underground or elevated, the value is for the ground surface). Elevation is only one factor in disaster preparedness. Check actual risks such as flooding on the Hazard Map Portal Site and the hazard maps published by local governments.
Elevation tiles for the profiles: processed from GSI Tiles
Access by rail
One of the nearest stations to Kashima Coastal Industrial Zone is Kashimajingu Station, served by the following lines.
- JR East Kashima Line
Source of line information: processed from National Land Numerical Information (Railway Data / Ministry of Land, Infrastructure, Transport and Tourism).
Change seen in the share of built-up area
This compares land use in 1976 and 2021. The share of built-up area within 500 m changed from 22% to 75%. Among the locations on this site, the spread of built-up area here is among the largest (top 20%). The bar below shows where this location falls in the distribution across the locations on this site.
Source: processed from National Land Numerical Information (Land Use Subdivision Mesh / 1976 and 2021 / Ministry of Land, Infrastructure, Transport and Tourism). The texture value (amount of fine detail) of the photographs changed from 13.5 to 27.3. This is a mechanical comparison between photographs and includes differences from the shooting season and from black and white versus color, so treat it only as a rough guide.
Official land prices over time
The official land price (Chika Koji) standard site nearest to this location is "6223-65 and adjacent lots, Okunoya Hamano, Kamisu, Ibaraki Prefecture" (about 2.9 km in a straight line; use: Office). The official prices per square meter at this standard site from 2011 to 2026 are shown below. The 2026 official price is 17,400 yen.
View as a table
| Year | Official price |
|---|---|
| 2011 | 20,000 yen |
| 2012 | 19,400 yen |
| 2013 | 18,500 yen |
| 2014 | 17,900 yen |
| 2015 | 17,400 yen |
| 2016 | 17,200 yen |
| 2017 | 17,100 yen |
| 2018 | 17,000 yen |
| 2019 | 17,000 yen |
| 2020 | 17,000 yen |
| 2021 | 17,000 yen |
| 2022 | 17,000 yen |
| 2023 | 17,000 yen |
| 2024 | 17,000 yen |
| 2025 | 17,200 yen |
| 2026 | 17,400 yen |
Source: processed from National Land Numerical Information (Land Price Publication Data / Ministry of Land, Infrastructure, Transport and Tourism). Official land prices are values published for standard sites as of January 1 each year and do not show the transaction price of any particular piece of land. The selection and location of standard sites may be reviewed from year to year.
Nearby locations
Sorted by distance from Kashima Coastal Industrial Zone. Comparing them together shows how the same area has changed over time.
Select a marker on the map to see the location name and a link to it.
Locations with the same origins
Towns in the same category as Kashima Coastal Industrial Zone (Reclaimed land), chosen from other regions. You can compare what they share in land use and town layout.
Select a marker on the map to see the location name and a link to it.
Articles that feature this location
Recently viewed towns
This history is saved only on your device and is not sent to any server. Depending on your browser settings, it may be deleted automatically if you do not visit for a while (it is less likely to be deleted if you use the site as an app).
Why not look at how another town has changed?
History of Kashima Coastal Industrial Zone
If you head east from in front of the gates of Kashima Jingu Shrine, a sandy plateau mixed with pines continues gently, and beyond it a world of nothing but straight lines suddenly begins. The Kashima Coastal Industrial Zone is an industrial area placed on dune land along the Kashima-nada Sea, at the eastern edge of Ibaraki Prefecture. The frame of this location takes in both the site of the steelworks at its core and the dug-in channel adjoining it. Kashima-Jingu Station on the Kashima Line is inland to the west, and neither the tracks nor the station come into the frame. The process until the surface that was sandy fields was filled with factories and piles of raw materials is preserved in four eras.
Dunes and strip-shaped fields
The elevation of this surface is around 8 m at all five measuring points. 8.1 m at the center, 8.0 m to the north and east, 8.1 m to the south and 8.2 m to the west. Even set side by side, they show almost no difference. Values are this even in an industrial area near the sea because the original relief was cut down and matched to a single height. The flatness of the numbers directly shows the flatness of the development.
The coast of the Kashima-nada Sea is made of a sandy beach long from north to south and dunes running along its inner side. There are no rocky capes and no inlets sheltered from the wind. The name Kashima had long been known across the country as the name of the shrine, but the sea side was for a long time a shore of fishing and fields. The condition that there was no place where large ships could berth became the greatest difficulty in placing an industrial area here.
The method adopted was not to push breakwaters out to sea but to dig the land. The inner side of the dunes is dug down, water is let through, and ships are brought in. The idea of digging the land to make a port makes sense on a coast where sandy beach goes on and on. The soil that is dug out becomes material for the development next to it as it is.
The oldest photograph, from 1961-69, is black and white with fine grain. From the upper right of the frame to the right edge is sea, with white streaks of waves lined up diagonally. The water's edge runs almost straight from north-northwest to south-southeast, and on its inner side there is a wide, bright band of sand. No structures made by people can be seen on the sea side.
The land side is fields from corner to corner. From the upper left to the center there is a grid tilted from northwest to southeast, with relatively large lots. Nearer the sea, long, narrow strips line up irregularly, and their directions do not match either. Dark masses of woods are dotted among the fields, with small clusters of houses beside them. Two narrow roads run north-south, and toward the bottom there is a single bright band running east-west. It is a surface of nothing but sand and fields, and there is still no channel and no factory anywhere.
The dug-in channel
In the 1974-78 photograph, the same frame has become almost a different place. On the right side that was sea, a dark navy channel cuts in diagonally from northeast to southwest, and both banks are fixed with straight seawalls. The straight lines of the edges show that the water did not come in from outside but was led through the land side. The straight line of the channel is the trace of digging. Near the side where the channel opens to the sea, in the upper right of the frame, a separate square notch enclosed by white seawalls has been made as a place to bring ships alongside.
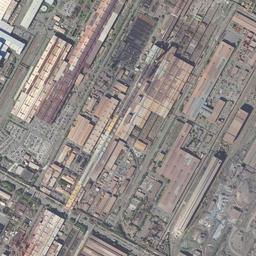
On the surface where the fields were, large equipment is already in place. In the center, tall tower-like structures and chimneys gather, and several streams of white smoke flow diagonally. From there thin lines extend in all directions, connecting to distant buildings and quays. From the lower middle to the lower left, many long brown to reddish-brown bands line up in parallel. In the upper left, large blue-gray roofs form diagonal rows, mixed with small red roofs. The upper right is wide, light brown bare ground with only three white round tanks on it. In the lower right, dozens of white round tanks are grouped together, and a ship is moored alongside a landing pier. In the span of just one era, the fields and the sea disappeared at the same time.
The bands of raw materials spread
In the 1979-83 photograph, the equipment in the center increases in density and extent. Reddish-brown buildings and structures spread thickly from the center toward the lower left, and on their east side a dark surface lined with many long bands has opened up widely. It reads as piles of stacked raw materials, but you cannot tell what was stacked. A road layout has been put into the wide lot in the upper right, and the white tanks remain unchanged at three. A thin jetty has been added to the channel on the right edge, and white wakes of small boats remain on the water. The group of tanks in the lower right has grown in number, and ships are at the quay.
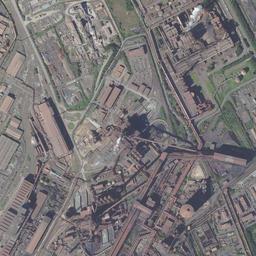
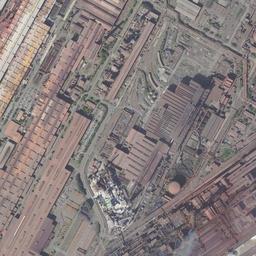
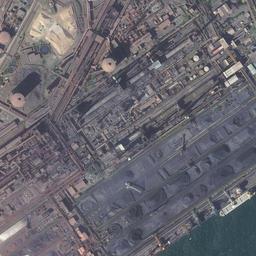
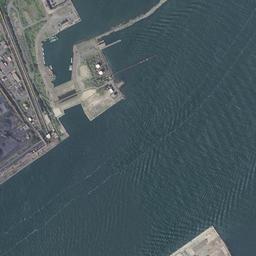
In the 1984-86 photograph, the colors of those bands come to look split in two. The wide surface right of center is black, and the band directly adjoining it to the southwest is reddish brown. Black and red line up in bands. The lines extending diagonally from the tall structures have increased in number and reach distant surfaces. The lot in the upper right remains light beige, with only the roads put in order and no buildings yet. On the sea side, two long, narrow jetties extend offshore east of the channel.
Edges where green was placed
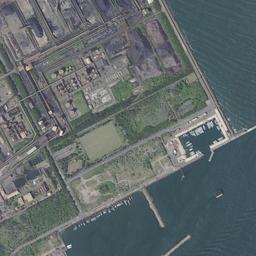
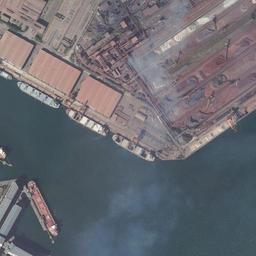
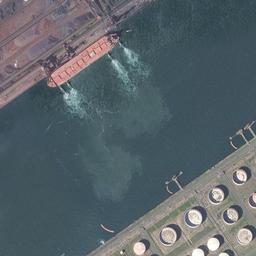
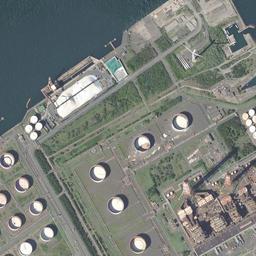
In today's photograph, the division of colors becomes even clearer. The wide yard in the center is gray-purple to black, and thin white lines run diagonally across it. They read as conveying equipment, but you cannot tell what type they are. The surface adjoining it to the southwest is reddish brown, with a long, narrow beige lot sandwiched in the middle. In the left half, long rust-colored roofs line up densely, each building facing the same direction. A large ship with a red hull is moored alongside the quay, and beyond it two white streaks extend thinly offshore on the water.
The change is at the edges. The lot in the upper right, where only roads had been drawn in 1984-86, is covered with the green of lawns and trees, and several white round tanks have been placed on it. On the water in the upper right corner, small boats are moored in a row, and on the surface in the lower right a band of green passes between the tanks. The green was placed afterward, a finishing touch after the surface had been filled in. The jetties of the channel remain, and short structures that take the waves line up along the coast.
No record of values is placed within this surface. The reference point is in Okunoya in the City of Kamisu, the neighbor to the south, about 2,900 m from the location, and it is land priced for office use rather than housing. Per square meter it was 20,000 yen in 2011 and is 17,400 yen in the 2026 official land prices (Chika Koji). Partway, in 2018, it was priced at 17,000 yen, and the gap between the years at either end is not very large. It is read not as the value of the surface lined with equipment itself, but as the value of land for setting up offices around that surface.
Although the elevation is around 8 m, the fact that this is a shore facing the open ocean directly does not change through the four eras. Expected tsunamis and storm surges are shown in map form on the hazard map published by the City of Kashima. It is a kind of information that cannot be read from the photographs. The channel that was dug through also means that a waterway was extended inland.
If you set the 1961-69 photograph beside today's, almost nothing remains on the surface. The grid of fields, the band of sand and the scattered woods are all gone. Even so, there is one thing that does not move. It is the direction of the sea's edge. The line tilted from north-northwest to south-southeast keeps the same angle in the four eras and today's photograph, whether dug or filled, and the channel, the bands of raw materials and the rows of buildings all take their direction from that diagonal.