Arcaport (Shimonoseki Waterfront) about 60 years ago and today
Then and now


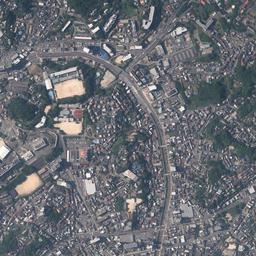
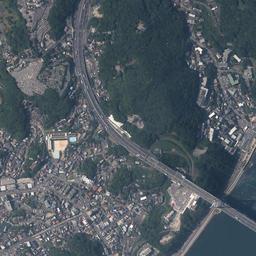

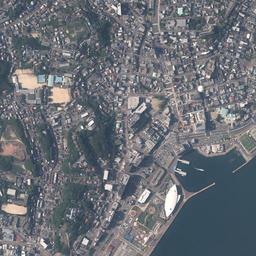
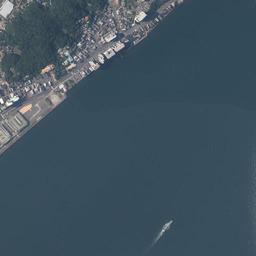





Center photograph taken:
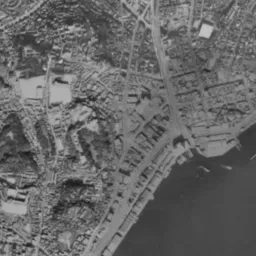
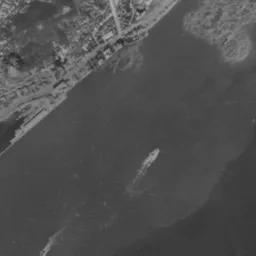
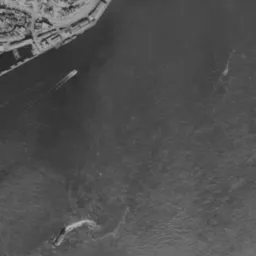
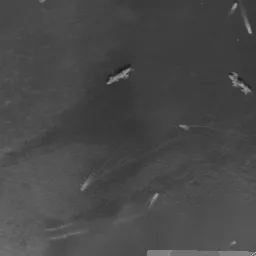
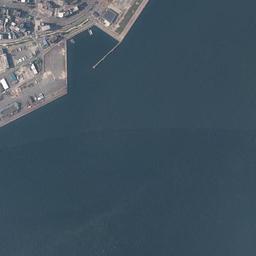
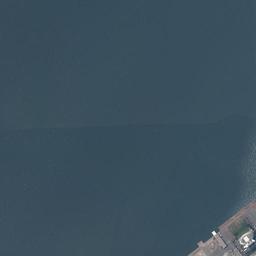
What to compare in this era: Warehouses line up on the thin band at the waterside, and short landing piers stick out. Count the ships scattered offshore and the white wakes.
Controls: drag to move / right-drag to rotate and tilt / scroll while holding ⌘ or Ctrl to zoomControls: slide with two fingers to move / pinch to zoom / drag two fingers up or down to tilt
Note: the 3D elevation data is based on current surveys, not on the terrain at the time of the photograph. Elevation tiles: processed from GSI Tiles
The 3D view could not be loaded. Check your connection and try again.
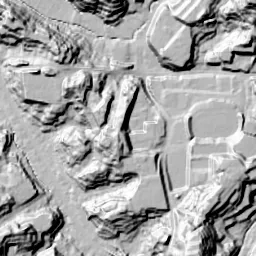
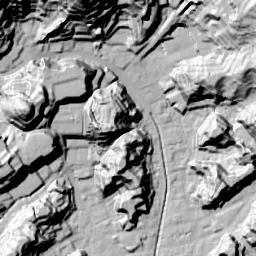
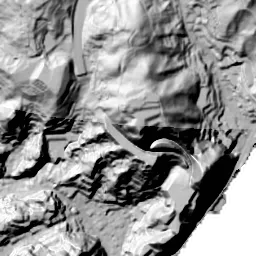
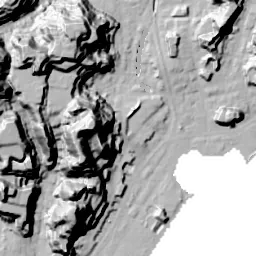
Note: the terrain shading is based on current surveys, not on the terrain at the time of the photograph. Hillshade map: processed from GSI Tiles
Note: the map is today's, not a map from the time of the photograph. Map: © OpenStreetMap contributors
Source: processed from GSI Tiles (aerial photographs by era / latest nationwide photographs / single photographs)
Explore this area on the mapMove the map to compare the surroundings then and now as well.
Overlay and compare the 1961-1969 aerial photograph and today's photograph of the Arcaport (Shimonoseki Waterfront) area, Yamaguchi Prefecture. All photographs are published by the Geospatial Information Authority of Japan (GSI).
Eras of photographs for this location
For the Arcaport (Shimonoseki Waterfront) area, aerial photographs from the following eras can be compared.
The old photographs of this location cover 2 eras from 1961-1969 to 1974-1978; as of 2026, the newest photograph, 1974-1978, is 51 years ago.There are no photographs of this location from after that until today. The differences between eras are summarized in the guide to aerial photograph eras.
Coverage for each era differs by region. Only the eras that actually have photographs of this location are listed here.
Elevation of this location
The elevation (above sea level) at the reference point of Arcaport (Shimonoseki Waterfront) is 2.4 m (source: GSI elevation API). Elevation profiles running east-west and north-south through this location are also shown.
Profile positions (vertical green line = north-south / horizontal blue line = east-west)
Where the line in a profile breaks off and leaves a gap, no elevation data is available (water surfaces such as the sea or rivers).
Elevation is the value at the ground surface (even where a station is underground or elevated, the value is for the ground surface). Elevation is only one factor in disaster preparedness. Check actual risks such as flooding on the Hazard Map Portal Site and the hazard maps published by local governments.
Elevation tiles for the profiles: processed from GSI Tiles
Access by rail
One of the nearest stations to Arcaport (Shimonoseki Waterfront) is Shimonoseki Station, served by the following lines.
- JR Kyushu Sanyo Line
- JR West Sanyo Line
Source of line information: processed from National Land Numerical Information (Railway Data / Ministry of Land, Infrastructure, Transport and Tourism).
Change seen in the share of built-up area
This compares land use in 1976 and 2021. The share of built-up area within 500 m changed from 37% to 47%. Among the locations on this site, the spread of built-up area here is on the small side (bottom 20-40%). The bar below shows where this location falls in the distribution across the locations on this site.
Source: processed from National Land Numerical Information (Land Use Subdivision Mesh / 1976 and 2021 / Ministry of Land, Infrastructure, Transport and Tourism). The texture value (amount of fine detail) of the photographs changed from 14.6 to 36.1. This is a mechanical comparison between photographs and includes differences from the shooting season and from black and white versus color, so treat it only as a rough guide.
Official land prices over time
The official land price (Chika Koji) standard site nearest to this location is "4-28-123 Kamitanaka-machi, Shimonoseki, Yamaguchi Prefecture" (about 1.2 km in a straight line; use: Residential). The official prices per square meter at this standard site from 1983 to 2026 are shown below. The 2026 official price is 50,000 yen.
View as a table
| Year | Official price |
|---|---|
| 1983 | 68,100 yen |
| 1984 | 70,500 yen |
| 1985 | 72,300 yen |
| 1986 | 73,900 yen |
| 1987 | 75,000 yen |
| 1988 | 75,200 yen |
| 1989 | 75,400 yen |
| 1990 | 76,200 yen |
| 1991 | 77,900 yen |
| 1992 | 81,000 yen |
| 1993 | 82,000 yen |
| 1994 | 82,000 yen |
| 1995 | 82,000 yen |
| 1996 | 82,000 yen |
| 1997 | 82,400 yen |
| 1998 | 82,400 yen |
| 1999 | 82,400 yen |
| 2000 | 82,400 yen |
| 2001 | 82,400 yen |
| 2002 | 81,100 yen |
| 2003 | 78,000 yen |
| 2004 | 72,500 yen |
| 2005 | 67,300 yen |
| 2006 | 63,900 yen |
| 2007 | 61,100 yen |
| 2008 | 60,100 yen |
| 2009 | 58,800 yen |
| 2010 | 55,600 yen |
| 2011 | 53,000 yen |
| 2012 | 51,000 yen |
| 2013 | 49,500 yen |
| 2014 | 48,500 yen |
| 2015 | 48,000 yen |
| 2016 | 47,700 yen |
| 2017 | 47,700 yen |
| 2018 | 48,000 yen |
| 2019 | 48,800 yen |
| 2020 | 48,600 yen |
| 2021 | 48,600 yen |
| 2022 | 48,700 yen |
| 2023 | 48,900 yen |
| 2024 | 49,300 yen |
| 2025 | 49,600 yen |
| 2026 | 50,000 yen |
Source: processed from National Land Numerical Information (Land Price Publication Data / Ministry of Land, Infrastructure, Transport and Tourism). Official land prices are values published for standard sites as of January 1 each year and do not show the transaction price of any particular piece of land. The selection and location of standard sites may be reviewed from year to year.
Nearby locations
Sorted by distance from Arcaport. Comparing them together shows how the same area has changed over time.
Select a marker on the map to see the location name and a link to it.
Locations with the same origins
Towns in the same category as Arcaport (Reclaimed land), chosen from other regions. You can compare what they share in land use and town layout.
Select a marker on the map to see the location name and a link to it.
Articles that feature this location
Recently viewed towns
This history is saved only on your device and is not sent to any server. Depending on your browser settings, it may be deleted automatically if you do not visit for a while (it is less likely to be deleted if you use the site as an app).
Why not look at how another town has changed?
History of Arcaport (Shimonoseki Waterfront)
The Kanmon Strait narrows where Honshu and Kyushu come closest. At Shimonoseki on the northern shore, the hills press right up to the sea, and the flat land is as thin as a band left between the water and the slopes. The town, the port and the railway had no choice but to be laid one on top of another on that thin band. The flat land jutting out square into the sea is something people added later.
This land was written Akamagaseki in old times and was also called Bakan. The name keeps the sense of a barrier on the strait, that is, a place that dealt with passage. The strait, with its fast tidal currents, made ships in the age of sail look for a place to wait. They dropped anchor offshore until the tide turned, waited for wind, and loaded water and food. A town that served them grew on the northern shore, and the ferries to the opposite shore also left from there. The reason the port was fixed on this waterside was neither the depth of a bay nor the breadth of a plain behind it, but the narrowness of the strait itself. The role did not change after the railway was extended here. At the nearest station, Shimonoseki Station, the tracks of the Sanyo Line are inherited by two passenger railway companies, and the fact that it is the transfer point at the western end of Honshu for crossing to Kyushu shows directly in the way the station came to be. The people and goods that had crossed by ship kept passing along the same thin band, turning into tracks and roads.
The relief of the land also shows in the elevation cross-section. The line heading west climbs quickly to 28.4 m. While the central measuring point is 2.4 m and the north 2.2 m, almost flat, only the west side is suddenly high. The south and east have no values, and the line ends partway. This is because those directions fall on the water surface of the strait. For the flooding assumptions on low land, the hazard map published by the City of Shimonoseki draws the zones and depths. Because the land has such a drop between the left and right of the cross-section, you will want to look at where the lines of the zones run side by side with the cross-section.
A town pushed up onto the hills
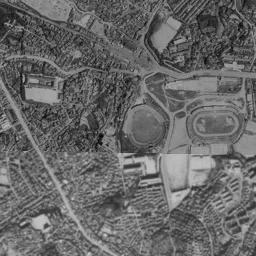
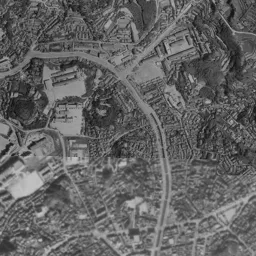
In the 1961-69 aerial photograph, the coastline cuts the frame diagonally from the lower left to the upper right. In a black-and-white photograph even the colors of the roofs cannot be told apart, but you can see well how densely the town is packed. On the long, narrow band at the waterside, long buildings that seem to be warehouses line up shoulder to shoulder, short landing piers stick out from there, and small boats lie alongside them. Behind the band, the rows of houses climb the slopes directly and extend thinly upward along the valleys. In the upper left of the frame, a sports facility with an oval track and a round structure is gathered, and the ground opens up brightly only around it. The upper right is a hill of dense forest, and the town stops at its foot.
The sea side is even busier. Offshore, more ships than can be counted are scattered, and many white wakes cross each other. In the lower left corner the shore juts square into the water, a long, narrow structure extends further beyond it, and ships are berthed side by side. A spread of pale murkiness shows on the sea surface, and shallow water and streaks of current can be made out.
An era of cutting the slopes
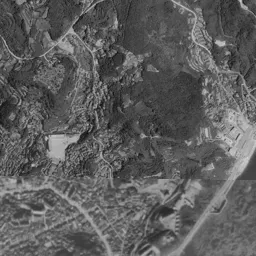
If you switch to 1974-78, the frame gains color, and it becomes visible that the change in the town was happening not at the sea but on the hills. Orange bare ground appears in spots all over the slopes. These are land development sites where trees were cleared and earth was cut to make terraces, and shapes large and small line up along the directions of the valleys and ridges. In lots already finished, small houses stand in rows, while the next lot is still the color of soil. It is the figure of a town that could no longer fit on the thin band, partway through escaping to higher ground.
The waterside also changes its form little by little. Warehouses with white roofs have increased on the pier in the lower left, and a large white ship lies alongside. To its east a gray, straight shore juts into the sea, and a long, narrow ship approaches it. However, the shore in the middle facing the strait still ends right in front of the buildings. Bands of uneven color run across the water surface, and the seams where photographs were joined can be made out. The number of ships is as large as in the black-and-white era.
The role of the port itself was moving greatly around this time. A railway tunnel was put under the strait in 1942, and in 1958 a tunnel that cars could pass through was added, so the need to cross the sea by ship faded. Then in 1973 a bridge was built. The flow of people and cars moved from the sea surface to under the seabed and into the air, and the quays at the waterside were left as places for cargo and fishing. In proportion to how far the town's center of gravity moved, land with no settled use appeared at the waterside.
A waterside that became a plaza
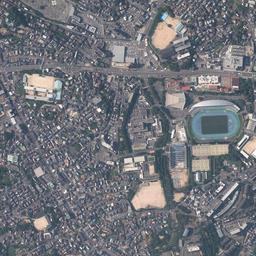
In today's photograph, that waterside has been squared off and put in order. The coastline is clearly further out to sea than in 1961-69, and flat land juts out. The gray of paving and the green of turf are painted separately lot by lot, and a large building with a white curved roof stands facing the sea. Beside it there is a small boat basin, with several small boats lined up. A wide road runs along the shore, and to the southwest a thin jetty extends diagonally. This area gained by reclamation has been given the name "Arcaport". To the extent that the shore was pushed out into the sea, there is now room to walk between the town and the water.
The pier in the lower left keeps working as a shore for cargo and fishing. Long warehouses line up, ships are berthed lengthwise, and the edge of the shore has been put in order as sharp-cornered straight lines. On the hill, the place that was an oval track in 1961-69 has become a stadium with a blue playing surface. In the northeast corner, the girder of a bridge spanning the water from the foot of the hill shows thinly. In the same position in the black-and-white era, this line does not exist. On the other hand, the ships offshore are sparse in this photograph, giving a different impression from the crowded sea surface of the two older eras. Because the times of day when they were taken also differ, the amount of traffic cannot be decided by the number of ships alone.
The one point where the movement of the value can be followed is not near the sea but inside the hills. It is residential land in Kamitanaka-machi 4-chome, about 1.2 km from the location. Per square meter, it was 68,100 yen in 1983 and 50,000 yen in the official land prices (Chika Koji) of 2026. The movement in between is not in one direction. It rose to 82,400 yen in 1997; the 47,700 yen recorded in both 2016 and 2017 is the lowest value up to the 2026 official land prices. From the row of numbers, you can read only that the values of residential land along the strait showed different faces in the period when land development advanced and after it.
The skeleton of thin flat land is still in the frame today. The green of the hills looks deeper and wider than in 1961-69, but the form in which houses are packed tightly right up to their foot has not changed. The slopes still decide the width of the town, and the land that increased is only what was added from the sea side. If you get off at Shimonoseki Station and go out to the waterside, the cargo shore, the reclaimed land that became a plaza, and the slopes heading toward where the strait narrows change places under your feet one after another.