Ube (Chemical Industry Town) about 60 years ago and today
Then and now
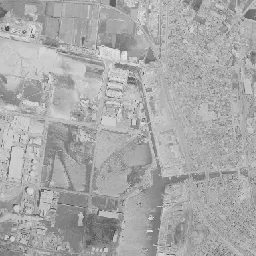
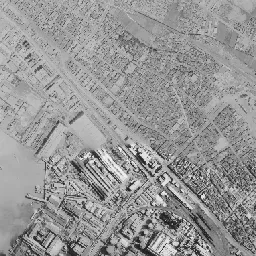
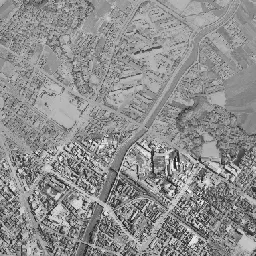
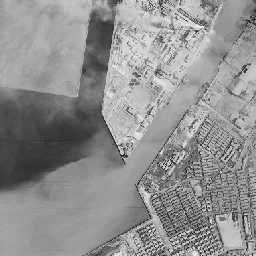
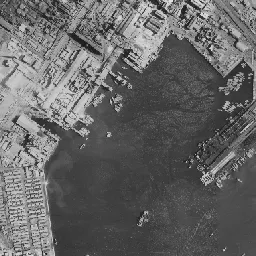
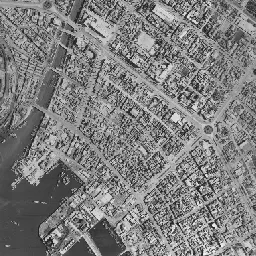
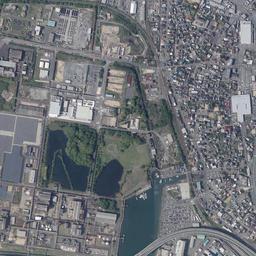
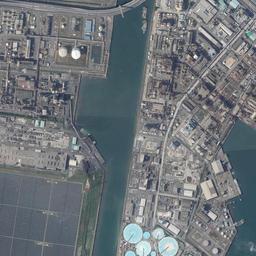
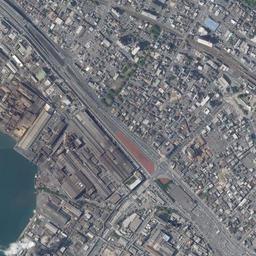
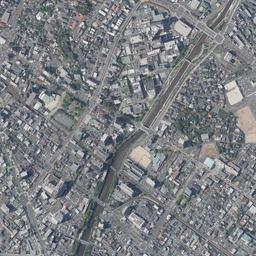
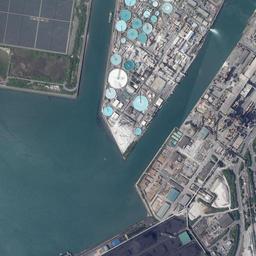
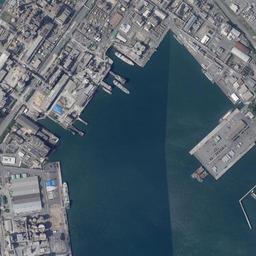
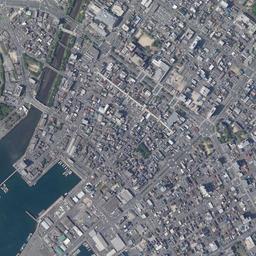


Center photograph taken: 1961-68
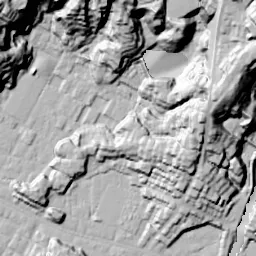
What to compare in this era: Look at the mass of factories from the middle of the frame to the southwest, and the faint inlet west of it. Neither the shape of the inlet nor the position of the factories has moved much up to today's photograph
Controls: drag to move / right-drag to rotate and tilt / scroll while holding ⌘ or Ctrl to zoomControls: slide with two fingers to move / pinch to zoom / drag two fingers up or down to tilt
Note: the 3D elevation data is based on current surveys, not on the terrain at the time of the photograph. Elevation tiles: processed from GSI Tiles
The 3D view could not be loaded. Check your connection and try again.
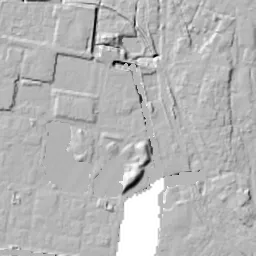
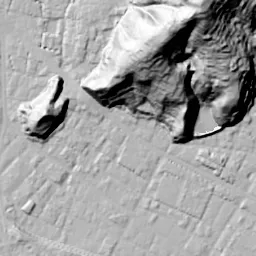
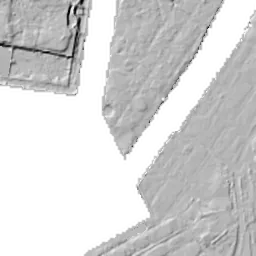
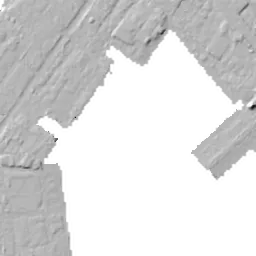
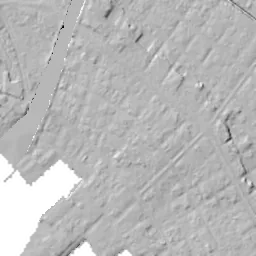
Note: the terrain shading is based on current surveys, not on the terrain at the time of the photograph. Hillshade map: processed from GSI Tiles
Note: the map is today's, not a map from the time of the photograph. Map: © OpenStreetMap contributors
Source: processed from GSI Tiles (aerial photographs by era / latest nationwide photographs / single photographs)
Explore this area on the mapMove the map to compare the surroundings then and now as well.
Overlay and compare the 1961-1969 aerial photograph and today's photograph of the Ube (Chemical Industry Town) area, Yamaguchi Prefecture. All photographs are published by the Geospatial Information Authority of Japan (GSI).
Eras of photographs for this location
For the Ube (Chemical Industry Town) area, aerial photographs from the following eras can be compared.
The old photographs of this location cover 2 eras from 1961-1969 to 1974-1978; as of 2026, the newest photograph, 1974-1978, is 51 years ago.There are no photographs of this location from after that until today. The differences between eras are summarized in the guide to aerial photograph eras.
Coverage for each era differs by region. Only the eras that actually have photographs of this location are listed here.
Elevation of this location
The elevation (above sea level) near Ube-Shinkawa Station is 3.8 m (source: GSI elevation API). Elevation profiles running east-west and north-south through this location are also shown.
Profile positions (vertical green line = north-south / horizontal blue line = east-west)
Elevation is the value at the ground surface (even where a station is underground or elevated, the value is for the ground surface). Elevation is only one factor in disaster preparedness. Check actual risks such as flooding on the Hazard Map Portal Site and the hazard maps published by local governments.
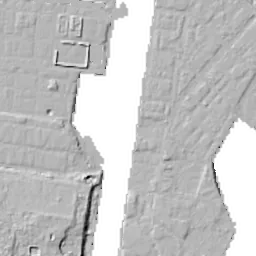
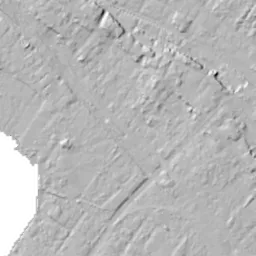
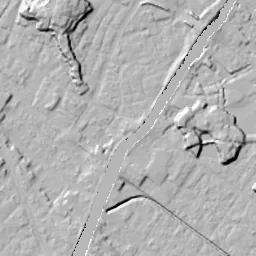
Elevation tiles for the profiles: processed from GSI Tiles
Access by rail
Ube-Shinkawa Station is served by the following lines.
- JR West Ube Line
Source of line information: processed from National Land Numerical Information (Railway Data / Ministry of Land, Infrastructure, Transport and Tourism).
Change seen in the share of built-up area
This compares land use in 1976 and 2021. The share of built-up area within 500 m changed from 82% to 99%. Among the locations on this site, the spread of built-up area here is in the middle. The bar below shows where this location falls in the distribution across the locations on this site.
Source: processed from National Land Numerical Information (Land Use Subdivision Mesh / 1976 and 2021 / Ministry of Land, Infrastructure, Transport and Tourism). The texture value (amount of fine detail) of the photographs changed from 17.8 to 31.7. This is a mechanical comparison between photographs and includes differences from the shooting season and from black and white versus color, so treat it only as a rough guide.
Official land prices over time
The official land price (Chika Koji) standard site nearest to this location is "6-7 Unoshima-cho, Ube, Yamaguchi Prefecture" (about 495 m in a straight line; use: Retail). The official prices per square meter at this standard site from 2004 to 2026 are shown below. The 2026 official price is 54,900 yen.
View as a table
| Year | Official price |
|---|---|
| 2004 | 114,000 yen |
| 2005 | 106,000 yen |
| 2006 | 98,800 yen |
| 2007 | 92,800 yen |
| 2008 | 88,200 yen |
| 2009 | 83,000 yen |
| 2010 | 77,200 yen |
| 2011 | 71,000 yen |
| 2012 | 64,400 yen |
| 2013 | 60,500 yen |
| 2014 | 58,000 yen |
| 2015 | 56,100 yen |
| 2016 | 54,900 yen |
| 2017 | 54,200 yen |
| 2018 | 53,800 yen |
| 2019 | 53,600 yen |
| 2020 | 53,500 yen |
| 2021 | 53,200 yen |
| 2022 | 53,200 yen |
| 2023 | 53,500 yen |
| 2024 | 53,800 yen |
| 2025 | 54,300 yen |
| 2026 | 54,900 yen |
Source: processed from National Land Numerical Information (Land Price Publication Data / Ministry of Land, Infrastructure, Transport and Tourism). Official land prices are values published for standard sites as of January 1 each year and do not show the transaction price of any particular piece of land. The selection and location of standard sites may be reviewed from year to year.
Nearby locations
Sorted by distance from Ube. Comparing them together shows how the same area has changed over time.
Select a marker on the map to see the location name and a link to it.
Locations with the same origins
Towns in the same category as Ube (Former factory site), chosen from other regions. You can compare what they share in land use and town layout.
Select a marker on the map to see the location name and a link to it.
Recently viewed towns
This history is saved only on your device and is not sent to any server. Depending on your browser settings, it may be deleted automatically if you do not visit for a while (it is less likely to be deleted if you use the site as an app).
Why not look at how another town has changed?
History of Ube (Chemical Industry Town)
The area in front of Ube-Shinkawa Station is the center of a town that rose on coal. However, because the coal of Ube was dug from under the sea, whichever era of the aerial photographs you open, nothing like the pit mouths or spoil heaps that come to mind when you hear "coal mining town" can be made out in the frame. Instead, the roofs of factories spreading around the port appear, along with round storage tanks lined up on a long, narrow strip of land jutting into the bay. The port from around the time coal stopped being mined appears with that layout as it was.
The coalfield under the sea and the factories
According to materials of the Coal Memorial Museum compiled by the City of Ube, the area of Ube and Sanyo-Onoda was called the "Ube Coalfield", and coal is thought to have been mined at least by the early part of the Edo period. From the middle of the Edo period salt making flourished along the coast of the Seto Inland Sea, and coal was used as fuel for boiling down the salt. From around the middle of the Meiji era, mining came to advance under the sea in search of more coal, and Ube became known as a town of undersea coal mines.
In 1897 local people put up the funds to form a cooperative for the Okinoyama Coal Mine. UBE's corporate history places this at the beginning of the company. Watanabe Yusaku, who was at its center, set out the aim of replacing coal, a finite resource that would one day be exhausted, with the value of industry, and of leaving lasting prosperity to the region. In line with that idea, an iron works that made and maintained coal-mining machinery was born in 1914, a cement company using limestone and waste soil from the mines in 1923, and a nitrogen industry company making the fertilizer ammonium sulfate from coal in 1933. In 1942 these four companies combined to become Ube Industries. Raising factories that used coal beside the coal mines came to decide the course of the town after the mines closed.
The framework of the town was also put in place in this period. Ube Village became a city in 1921 without passing through the stage of a town, and in 1925 the Ube Railway between Ube and Ogori was opened along its whole length. This is today's JR Ube Line. In 1933 Ube Port was completed.
Even before mining ended, chemical work had spread beyond coal. In UBE's corporate history, the Ube Caprolactam Plant was newly built in 1955 and the manufacture of caprolactam began, and in 1959 the company moved on to manufacturing nylon 6 resin using it as raw material. In 1969, two years after the mine closure, the Coal Memorial Museum, which passes on the history of the coalfield, opened on the shore of Lake Tokiwa. The memory of the work of digging moved to an exhibition by the lake, while chemical work remained in the factories at the port.
A photograph that straddles the mine closure
The 1961-69 photograph falls exactly in the period straddling the end of mining. In the chronology of the City of Ube, Ube Industries' Ube Mining Works closed in 1967, and with this as the last, all the coal mines of the Ube Coalfield were closed. Even so, no emptiness suggesting an end appears in the frame. A mass of factories packed with roofs spreads from the middle of the frame toward the southwest, and its position corresponds to the place UBE shows on its maps as the Ube Chemical Factory. West of the factories a faintly shining inlet cuts in, to the south the dark water surface of the port spreads, and ships crowd at the edge of the quays. Tracks coming down diagonally from the upper left split into many lines just before the port.
At the left edge of the frame, a long, narrow strip of land juts south across a thin waterway, and partway along it white round storage tanks line up. At its northern end too, factory buildings and storage tanks are grouped together. A wide water surface under the shadow of clouds lies further left, and a flat surface with a faint outline floats on it. The right half looks different: a river straightened into a line flows from the upper right downward, and a fine grid of rows of houses fills both its banks. The top third of the frame is hills covered with fields and woods, and there is a pond in the upper right corner. The factories, the port and the town are concentrated in the south, while in the north the color of fields still prevails; this north-south difference is the composition of this era.
Reading the port and the storage tanks by color
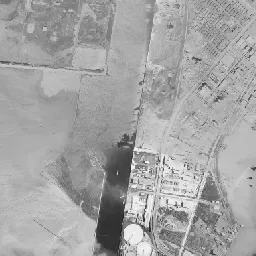
In 1974-78, many tracks are bundled beside the factories in the center, and a yard extends diagonally. Reddish-brown roofs are mixed in among the factory roofs. In the eastern part of the port, a long, narrow landing pier carrying tracks juts into the water, and a structure that connects ships and freight cars directly can be seen. On the long, narrow strip of land on the left, several greenish round storage tanks line up, and on the flat land west of it white rectangular lots line up neatly. In the upper left corner, factory buildings and round storage tanks are also grouped on the far bank of the waterway, and beside them two dark green water surfaces like ponds lie side by side. On the hills at the top, bare ground is carved between the woods, and much of the fields on the north side has been replaced by rows of houses and school grounds. This photograph is from about ten years after the mine closure, yet the area of the factories around the port does not look smaller than in 1961-69.
The flat land jutting into the sea and the surroundings of the inlet have many places of low elevation. The City of Ube has compiled on its hazard map the assumptions of how far storm surges and flooding would reach.
Overlaying three points in time
The outlines of the inlet and the port, and the shape of the long, narrow strip of land on the left, have hardly changed in the photograph as of 2026 from the two older eras. The change is in the contents. The bundle of tracks has fewer lines, and the tracks have disappeared from the landing pier in the eastern part of the port, which has become a flatly paved quay. The round storage tanks on the land on the left have changed to light blue roofs while keeping their arrangement, and the white rectangular lots west of them are covered by a dark surface of fine grid. In the upper left of the frame, an elevated road crosses the waterway in a large arc. The bare ground on the hills at the top has returned to woods and remains as a mass of green.
UBE changed its company name from Ube Industries in 2022. As of 2026 the addresses of the Ube Works and the Ube Chemical Factory are both in Oaza Kogushi, which on the map corresponds to the corner of the factories that appears in the center of the photograph. The coal dug under the sea left almost no trace above ground, but the factories placed for the sake of coal stayed in the same place after the mines closed. If you line up the three points in time, the transition from a coal mining town to a chemical industry town appears not as a replacement of the land but as a replacement of the contents of the factories surrounding the port.