Mizushima Waterfront (Kurashiki) about 60 years ago and today
Then and now














Center photograph taken:
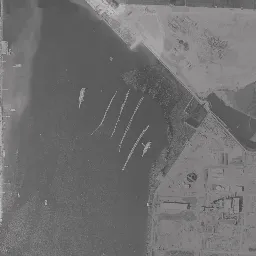
What to compare in this era: Look for the rows of white dots on the water surface on the right of the frame. The bright band along the east bank looks like shallows exposed by the low tide
Controls: drag to move / right-drag to rotate and tilt / scroll while holding ⌘ or Ctrl to zoomControls: slide with two fingers to move / pinch to zoom / drag two fingers up or down to tilt
Note: the 3D elevation data is based on current surveys, not on the terrain at the time of the photograph. Elevation tiles: processed from GSI Tiles
The 3D view could not be loaded. Check your connection and try again.
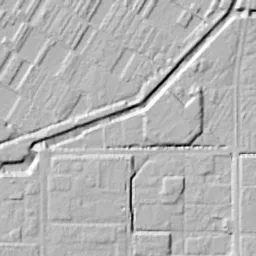
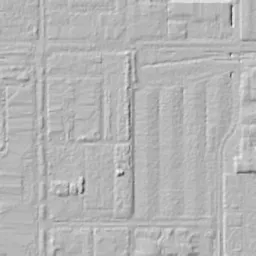
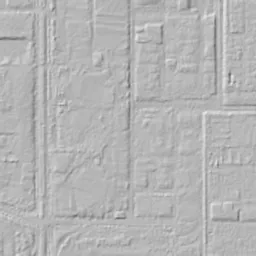
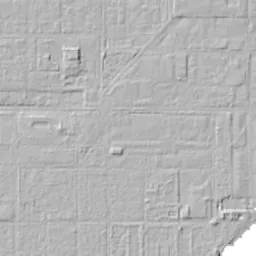
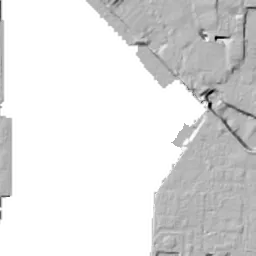
Note: the terrain shading is based on current surveys, not on the terrain at the time of the photograph. Hillshade map: processed from GSI Tiles
Note: the map is today's, not a map from the time of the photograph. Map: © OpenStreetMap contributors
Source: processed from GSI Tiles (aerial photographs by era / aerial photographs by fiscal year / latest nationwide photographs / single photographs / survey periods of the photographs)
Explore this area on the mapMove the map to compare the surroundings then and now as well.
Overlay and compare the 1961-1969 aerial photograph and today's photograph of the Mizushima Waterfront (Kurashiki) area, Okayama Prefecture. All photographs are published by the Geospatial Information Authority of Japan (GSI).
Eras of photographs for this location
For the Mizushima Waterfront (Kurashiki) area, aerial photographs from the following eras can be compared.
The old photographs of this location cover 4 eras from 1961-1969 to FY2007; as of 2026, the newest photograph, FY2007, is 18-19 years ago.There are no photographs of this location from after that until today. The differences between eras are summarized in the guide to aerial photograph eras.
Coverage for each era differs by region. Only the eras that actually have photographs of this location are listed here.
Elevation of this location
The elevation (above sea level) at the reference point of Mizushima Waterfront (Kurashiki) is 2.8 m (source: GSI elevation API). Elevation profiles running east-west and north-south through this location are also shown.
Profile positions (vertical green line = north-south / horizontal blue line = east-west)
Elevation is the value at the ground surface (even where a station is underground or elevated, the value is for the ground surface). Elevation is only one factor in disaster preparedness. Check actual risks such as flooding on the Hazard Map Portal Site and the hazard maps published by local governments.
Elevation tiles for the profiles: processed from GSI Tiles
Access by rail
One of the nearest stations to Mizushima Waterfront (Kurashiki) is Mizushima Station, served by the following lines.
- Mizushima Rinkai Railway Mizushima Main Line
Source of line information: processed from National Land Numerical Information (Railway Data / Ministry of Land, Infrastructure, Transport and Tourism).
Change seen in the share of built-up area
This compares land use in 1976 and 2021. The share of built-up area within 500 m changed from 56% to 74%. Among the locations on this site, the spread of built-up area here is in the middle. The bar below shows where this location falls in the distribution across the locations on this site.
Source: processed from National Land Numerical Information (Land Use Subdivision Mesh / 1976 and 2021 / Ministry of Land, Infrastructure, Transport and Tourism). The texture value (amount of fine detail) of the photographs changed from 8.4 to 28.1. This is a mechanical comparison between photographs and includes differences from the shooting season and from black and white versus color, so treat it only as a rough guide.
Official land prices over time
The official land price (Chika Koji) standard site nearest to this location is "3-49-39 Namba, Kurashiki, Okayama Prefecture" (about 1.1 km in a straight line; use: Residential). The official prices per square meter at this standard site from 1995 to 2026 are shown below. The 2026 official price is 33,600 yen.
View as a table
| Year | Official price |
|---|---|
| 1995 | 76,500 yen |
| 1996 | 77,200 yen |
| 1997 | 78,200 yen |
| 1998 | 78,200 yen |
| 1999 | 76,000 yen |
| 2000 | 73,000 yen |
| 2001 | 69,400 yen |
| 2002 | 63,900 yen |
| 2003 | 59,000 yen |
| 2004 | 53,800 yen |
| 2005 | 48,500 yen |
| 2006 | 45,700 yen |
| 2007 | 44,200 yen |
| 2008 | 43,600 yen |
| 2009 | 42,700 yen |
| 2010 | 41,300 yen |
| 2011 | 40,000 yen |
| 2012 | 38,700 yen |
| 2013 | 37,400 yen |
| 2014 | 36,500 yen |
| 2015 | 35,800 yen |
| 2016 | 35,500 yen |
| 2017 | 35,100 yen |
| 2018 | 34,700 yen |
| 2019 | 34,400 yen |
| 2020 | 34,200 yen |
| 2021 | 34,000 yen |
| 2022 | 33,800 yen |
| 2023 | 33,600 yen |
| 2024 | 33,600 yen |
| 2025 | 33,600 yen |
| 2026 | 33,600 yen |
Source: processed from National Land Numerical Information (Land Price Publication Data / Ministry of Land, Infrastructure, Transport and Tourism). Official land prices are values published for standard sites as of January 1 each year and do not show the transaction price of any particular piece of land. The selection and location of standard sites may be reviewed from year to year.
Nearby locations
Sorted by distance from Mizushima Waterfront. Comparing them together shows how the same area has changed over time.
Select a marker on the map to see the location name and a link to it.
Locations with the same origins
Towns in the same category as Mizushima Waterfront (Reclaimed land), chosen from other regions. You can compare what they share in land use and town layout.
Select a marker on the map to see the location name and a link to it.
Articles that feature this location
Recently viewed towns
This history is saved only on your device and is not sent to any server. Depending on your browser settings, it may be deleted automatically if you do not visit for a while (it is less likely to be deleted if you use the site as an app).
Why not look at how another town has changed?
History of Mizushima Waterfront (Kurashiki)
The lowland of Mizushima spreads east of the mouth of the Takahashi River, where it runs out into the Seto Inland Sea. It is land well known as an industrial zone, but this frame holds not only factories. A wide water surface runs north to south through the right side of the frame, and the water widens the farther south it goes, until in the bottom corner the distance to the opposite bank is hard to measure. The front line of reclamation advanced still farther offshore than this, but the water of the port itself appears in every one of the four eras.
Salt fields, polders and the memory of a shallow sea
The river mouth was originally a shallow sea where, when the tide went out, surfaces of sand and mud appeared far offshore. Salt fields and paddies made by land reclamation by drainage (polder) were added toward the sea one lot at a time, relying on that shallowness, and the small islands that floated in the river mouth were surrounded by embankments and paddies and joined to the land. Only the names from when they were islands remain as place names, and the name Mizushima (shima means island) also belongs to that line. The history of people adding to the sea has become the name of the land as it is.
The lowness shows in the measured values. Around the center at 2.8 m, the west is 3.0 m, the north 2.9 m and the south 2.8 m. The values on all four sides hardly move, showing a surface like a single board spread at a height close to the water. Only the east drops to 1.2 m, but that is the side toward the waterway in the frame, lower by the amount it falls toward the bank.
In wartime, this flat, wide lowland was chosen for a different reason. An aircraft factory became the first core, and a large site was cut out between the paddies and the salt fields. After the war that site and the arrangements for reclamation were carried over, and through development led by the prefecture and the attraction of companies, factories for oil refining, steel and automobiles lined up toward the sea. A private track laid for the factories later became a railway that also carries people.
A water surface lined with rows of stakes
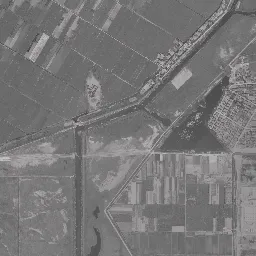
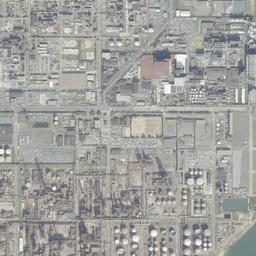
In the black-and-white 1961-69 photograph, the frame is divided into several domains. A surface of factories and workyards cut by large roofs and straight roads extends from the center toward the left; outside it, at the left edge, wide stripes of strip-shaped fields remain, and in the middle of the top edge the dense rows of houses of the Mizushima urban area peek in. The upper right is farmland where square fields continue, the lot lines run unbroken to the northern edge, and clusters of buildings that look like settlements are mixed in here and there. And from the middle of the right side downward is water. The water surface is narrow and pointed at the top and widens as it goes south.
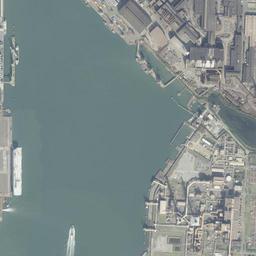
If you look closely at this water surface, 4 or 5 rows of white dots strung together like beads are placed on the water, swaying diagonally. They look like devices of thin stakes set up at equal intervals, and between them two long, narrow white shapes float. They are boats. A light gray band runs along the east bank, and the boundary between water and earth is blurred. These are probably shallows or sandbars exposed by the low tide. Outside it a long, straight embankment and structures that look like landing piers jut out, and inside the embankment a wide, bright, flat surface continues. It is ground with only a few clumps of trees left here and there, looking as if development had just been finished.
The lower left should not be overlooked either. There is one large dark water surface enclosed squarely by straight embankments, and the area around it is flat ground where lot lines faintly remain. In the middle of the bottom edge, round tanks already form a small group. This is the industrial zone partway through having its framework drawn.
Tanks filling the lowland
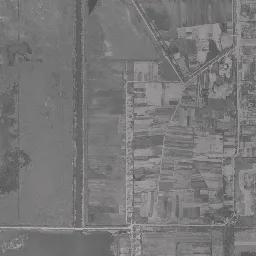
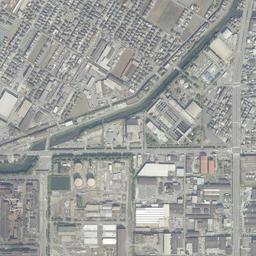
The 1974-78 photograph is in color. A break in the color itself catches the eye first: the tone changes between the upper 40% and the lower 60% of the frame, and a single horizontal seam runs across. The lower side is yellowed, and the upper side leans toward gray and green. Two photographs taken on different days have been joined into one picture.
The change in content is large. Toward the top of the center, dozens of long, narrow buildings line up in parallel at the same intervals, and an oval of flat ground lies south of them. This shape with rounded ends looks like a circuit used for driving tests, and long, narrow buildings run along its north edge. From the center of the lowland downward, white round tanks form groups and spread out in several clusters. There is also a small group of tanks in the upper left, and dark, irregular ponds remain between the buildings. The waterway is sunk in a greenish color, and many small boats line both banks as white dots. In other words, the rows of stakes became rows of boats. The right bank is still strip-shaped fields, with buildings scattered beyond them.
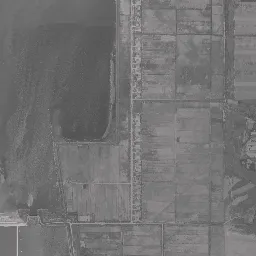
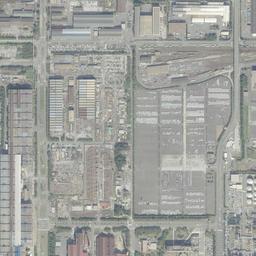
By 1979-83 the color seam has disappeared, and the whole can be viewed in a single tone. On the left, long buildings with red and blue roofs stand in rows, and in the center the groups of white tanks increase further in number. Landing piers jut out into the waterway, and ships arrive at their ends. Toward the bottom of the right bank, structures that look like slipways line up, and the long, narrow shapes lying on them look like ships under construction or under repair. By contrast, in the upper half of the right bank, dark green square fields remain together, showing that vegetables were being grown on the bank opposite the factories. In the middle of the top edge, a single dark green grove stays put, keeping its round outline.
The lot where the oval disappeared
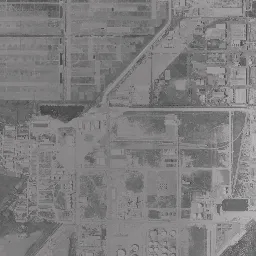
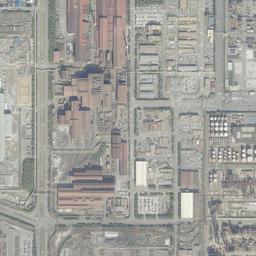
In today's photograph, the east bank of the waterway and the upper left of the frame have changed most. The green fields that remained on the east bank have been replaced by buildings and paved surfaces, and the striped fields in the upper left have also been filled with the roofs of houses and warehouses. In this way the fields retreated outside the frame.
In the industrial zone in the center, the oval of flat ground has disappeared. In its place large roofs and wide paved surfaces have been set, and on its east side the ramps of an elevated road wind around in two loops. These are lines that were in none of the three eras from 1961-69 to 1979-83. The things that have not changed are also clear. The grove at the top edge is there with almost the same shape and size, and the square lot holding water south of it has not moved from its position since 1974-78. The groups of tanks also line up in the same places.
The size of what floats on the waterway changes as you follow the eras. In 1961-69 there are rows of stakes and two small boats; in 1974-78, small boats crowded along both banks; in 1979-83, ships arriving at the ends of landing piers and long, narrow shadows lying on slipways. In today's photograph a large white ship lies alongside the bank, and offshore from it small boats cross trailing wakes. Although the width of the water surface itself has hardly changed, only the ships that use it have grown larger. It can be read that making the depth and the construction of the banks uniform worked better than increasing the area of water.
A record of residential land values running from 1995 remains about 1.1 km from this location. It began at 76,500 yen per square meter, and after reaching its highest value of 78,200 yen in 1997 and 1998 it went down a long slope, and 33,600 yen from 2023 to 2026 is the lowest in the official land prices (Chika Koji) up to 2026. Even as the concentration of factories continued, the value of land for living drew a different curve.
The assumptions for how water would come are divided finely address by address. It is worth checking the lots you care about one by one on the hazard map published by the City of Kurashiki. The elevation figures show that this surface, appearing in the four eras, is in every case set just above the water.