Tomioka (Tomioka Silk Mill) about 60 years ago and today
Then and now
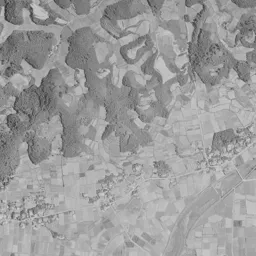
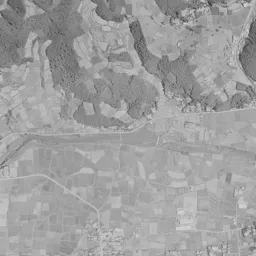
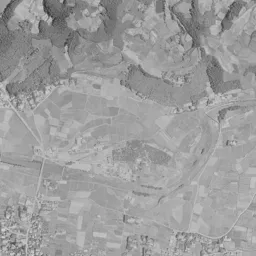
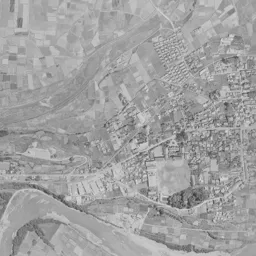
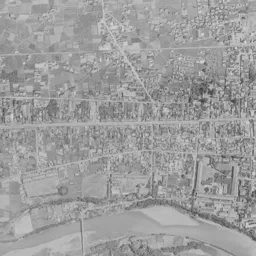
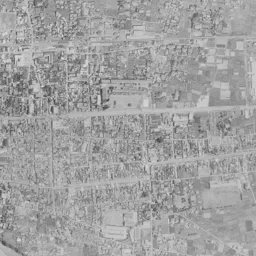
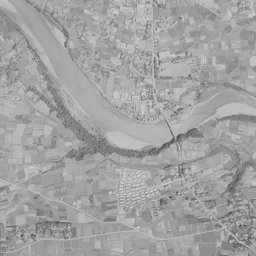
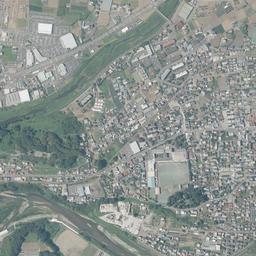
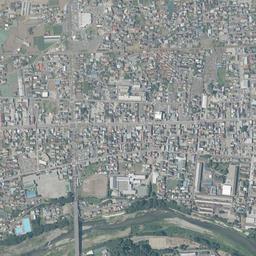
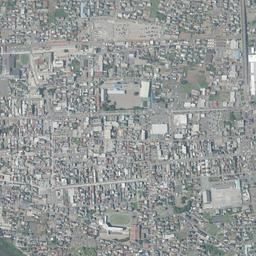
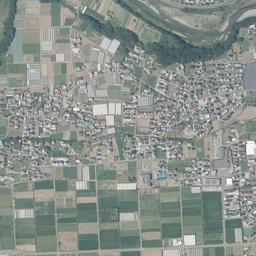
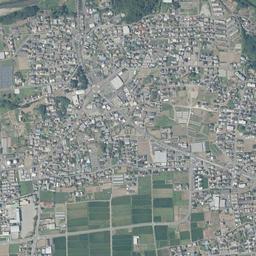
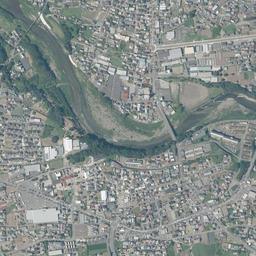
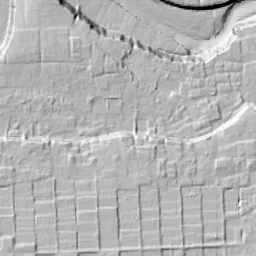
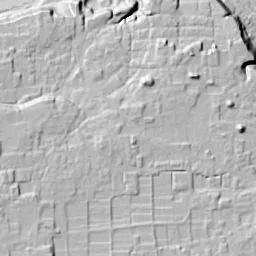
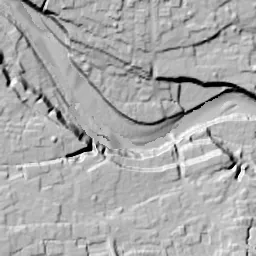


Center photograph taken: 1962-67
What to compare in this era: Follow south from the east-west street in the center, and look for the long roofs arranged in a squared U shape just before the riverbank. The difference in size from the roofs of the surrounding houses is clear
Controls: drag to move / right-drag to rotate and tilt / scroll while holding ⌘ or Ctrl to zoomControls: slide with two fingers to move / pinch to zoom / drag two fingers up or down to tilt
Note: the 3D elevation data is based on current surveys, not on the terrain at the time of the photograph. Elevation tiles: processed from GSI Tiles
The 3D view could not be loaded. Check your connection and try again.
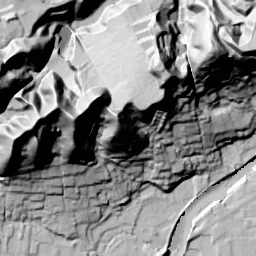
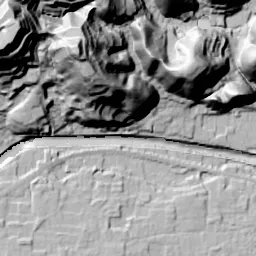
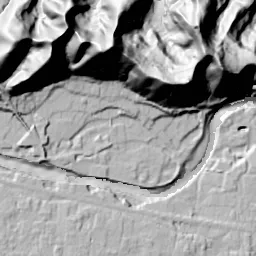
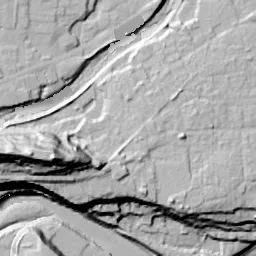
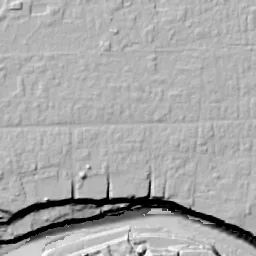
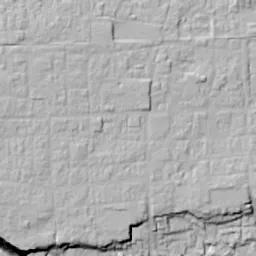
Note: the terrain shading is based on current surveys, not on the terrain at the time of the photograph. Hillshade map: processed from GSI Tiles
Note: the map is today's, not a map from the time of the photograph. Map: © OpenStreetMap contributors
Source: processed from GSI Tiles (aerial photographs by era / latest nationwide photographs / single photographs)
Explore this area on the mapMove the map to compare the surroundings then and now as well.
Overlay and compare the 1961-1969 aerial photograph and today's photograph of the Tomioka (Tomioka Silk Mill) area, Gunma Prefecture. All photographs are published by the Geospatial Information Authority of Japan (GSI).
Eras of photographs for this location
For the Tomioka (Tomioka Silk Mill) area, aerial photographs from the following eras can be compared.
The old photographs of this location cover 2 eras from 1961-1969 to 1974-1978; as of 2026, the newest photograph, 1974-1978, is 51 years ago.There are no photographs of this location from after that until today. The differences between eras are summarized in the guide to aerial photograph eras.
Coverage for each era differs by region. Only the eras that actually have photographs of this location are listed here.
Elevation of this location
The elevation (above sea level) at the reference point of Tomioka (Tomioka Silk Mill) is 169.5 m (source: GSI elevation API). Elevation profiles running east-west and north-south through this location are also shown.
Profile positions (vertical green line = north-south / horizontal blue line = east-west)
Elevation is the value at the ground surface (even where a station is underground or elevated, the value is for the ground surface). Elevation is only one factor in disaster preparedness. Check actual risks such as flooding on the Hazard Map Portal Site and the hazard maps published by local governments.
Elevation tiles for the profiles: processed from GSI Tiles
Access by rail
One of the nearest stations to Tomioka (Tomioka Silk Mill) is Joshu-Tomioka Station, served by the following lines.
- Joshin Electric Railway Joshin Line
Source of line information: processed from National Land Numerical Information (Railway Data / Ministry of Land, Infrastructure, Transport and Tourism).
Change seen in the share of built-up area
This compares land use in 1976 and 2021. The share of built-up area within 500 m changed from 49% to 82%. Among the locations on this site, the spread of built-up area here is on the large side (top 20-40%). The bar below shows where this location falls in the distribution across the locations on this site.
Source: processed from National Land Numerical Information (Land Use Subdivision Mesh / 1976 and 2021 / Ministry of Land, Infrastructure, Transport and Tourism). The texture value (amount of fine detail) of the photographs changed from 9.6 to 27.4. This is a mechanical comparison between photographs and includes differences from the shooting season and from black and white versus color, so treat it only as a rough guide.
Official land prices over time
The official land price (Chika Koji) standard site nearest to this location is "1055-1 Nanokaichi Funakubo, Tomioka, Gunma Prefecture" (about 491 m in a straight line; use: Residential). The official prices per square meter at this standard site from 1983 to 2026 are shown below. The 2026 official price is 29,500 yen.
View as a table
| Year | Official price |
|---|---|
| 1983 | 56,900 yen |
| 1984 | 59,200 yen |
| 1985 | 59,900 yen |
| 1986 | 60,500 yen |
| 1987 | 61,100 yen |
| 1988 | 62,100 yen |
| 1989 | 64,100 yen |
| 1990 | 68,100 yen |
| 1991 | 73,900 yen |
| 1992 | 77,900 yen |
| 1993 | 74,500 yen |
| 1994 | 73,100 yen |
| 1995 | 73,000 yen |
| 1996 | 72,300 yen |
| 1997 | 72,000 yen |
| 1998 | 71,700 yen |
| 1999 | 70,700 yen |
| 2000 | 68,100 yen |
| 2001 | 62,900 yen |
| 2002 | 58,100 yen |
| 2003 | 54,100 yen |
| 2004 | 50,800 yen |
| 2005 | 48,100 yen |
| 2006 | 46,300 yen |
| 2007 | 45,500 yen |
| 2008 | 45,000 yen |
| 2009 | 44,500 yen |
| 2010 | 43,300 yen |
| 2011 | 41,800 yen |
| 2012 | 39,400 yen |
| 2013 | 37,100 yen |
| 2014 | 35,700 yen |
| 2015 | 34,900 yen |
| 2016 | 34,300 yen |
| 2017 | 33,800 yen |
| 2018 | 33,400 yen |
| 2019 | 33,000 yen |
| 2020 | 32,600 yen |
| 2021 | 32,000 yen |
| 2022 | 31,400 yen |
| 2023 | 30,800 yen |
| 2024 | 30,300 yen |
| 2025 | 29,900 yen |
| 2026 | 29,500 yen |
Source: processed from National Land Numerical Information (Land Price Publication Data / Ministry of Land, Infrastructure, Transport and Tourism). Official land prices are values published for standard sites as of January 1 each year and do not show the transaction price of any particular piece of land. The selection and location of standard sites may be reviewed from year to year.
Nearby locations
Sorted by distance from Tomioka. Comparing them together shows how the same area has changed over time.
Select a marker on the map to see the location name and a link to it.
Locations with the same origins
Towns in the same category as Tomioka (Former factory site), chosen from other regions. You can compare what they share in land use and town layout.
Select a marker on the map to see the location name and a link to it.
Recently viewed towns
This history is saved only on your device and is not sent to any server. Depending on your browser settings, it may be deleted automatically if you do not visit for a while (it is less likely to be deleted if you use the site as an app).
Why not look at how another town has changed?
History of Tomioka (Tomioka Silk Mill)
The town of Tomioka, stretching long and narrow along the north bank of the Kabura River in southwestern Gunma Prefecture, has grown together with the government-run machine silk-reeling mill that began operating in 1872. A little to the lower right of the center of the aerial photograph, just before the town reaches all the way down to the riverbank, there is a corner where long buildings are arranged in a squared U shape. This is the Tomioka Silk Mill. The past aerial photographs available at this location are those of 1961-69 and 1974-78, and both fall in the period when the mill was still reeling silk. If you add today's photograph and set them side by side, you can read how the shape of the mill buildings stays the same while only the way the surrounding town and the land along the river are used changes.
The site of an administrative compound along the Kabura River
The person entrusted with planning the mill was Paul Brunat, a Frenchman who had been involved in inspecting raw silk in Yokohama. According to the official tourist guide of the City of Tomioka, Brunat toured the silkworm-raising areas near Edo and then chose Tomioka as the construction site because it was not far from Yokohama and raw cocoons could be gathered there. The site chosen for the mill was the wide former site of an administrative compound (jin'ya) along the Kabura River. For the water essential to silk reeling, the plan was to draw it from the Nanokaichi irrigation channel flowing on the north side of the site, and local consent was also obtained. Construction began in 1871, and the next year, 1872, the main buildings were completed and operation began. In the silk-reeling hall, about 140 m long, 300 basins of reeling machines brought in from France stood in rows, the largest scale of any silk mill in the world at the time. The east and west cocoon warehouses for storing cocoons were built as a pair, and the East Cocoon Warehouse is about 104 m long. Trainee women workers gathered from all over the country worked in the silk-reeling hall, and full-scale machine silk reeling began here. From 1876, when the French instructors left, the mill was run by Japanese staff alone.
The period of government operation ended after a little over 20 years. It was sold to the Mitsui family in 1893, and after it was transferred to Hara Gomei Kaisha in 1902, it became known for mass production of high-quality raw silk with multi-end reeling machines and for improving silkworm eggs. After becoming independent as Tomioka Seishijo Co., Ltd. in 1938, it was merged the next year, 1939, into Katakura Seishi Boseki, then the largest silk-reeling company in Japan. The fact that it kept running consistently as a silk mill even as its owners changed is at the core of this mill's history.
The town and the mill in two eras
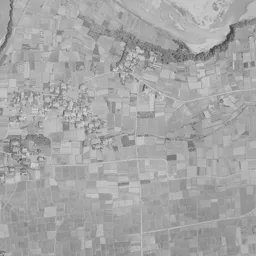
A dark range of mountains with many folds runs along the top edge of the frame, and lots of fields reach into the valleys. This is the northern end of the 1961-69 photograph; a thin river crosses east-west a little below the foot of the mountains, and fields and paddies spread south of it. A single street runs straight east-west through the center of the frame, and rows of houses are packed densely along it. The town is thicker toward the right, the east, and narrow roads crossing the street at right angles are cut in a form close to a grid. In the lower part of the frame the Kabura River flows from left to right, a broad riverbed of gravel shining white continues, and at the lower right the river bends sharply to the south. The silk mill is at the southern edge of the town, just before the riverbank; its long roofs are combined at right angles and look like they belong to a different scale from the small roofs of the houses around them. The area south of the river is mostly fields and scattered settlements, and only the lower right corner holds a cluster where buildings of the same shape stand in rows. The tone of the whole photograph is a light gray; the water surface and riverbed of the river, the roofs of the town and the woods of the mountains each separate into different shades, and the uses of the land line up directly as bands of light and dark.
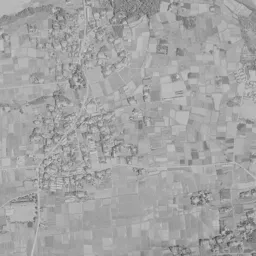
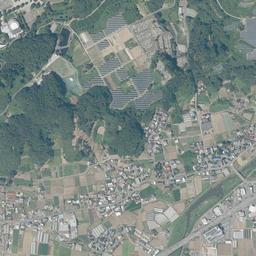
The layout of the mill buildings in the 1974-78 photograph is also unchanged from the previous era, and the squared U arrangement is easier to read here. The whole photograph has a yellow-green tinge, and only the part with the mountains at the top edge joins in a different, dark tone. Next to the mill on the west, a cluster of white buildings can be seen, and further west an open space that looks like a schoolyard. A bridge crossing the river appears at the lower center, and along the river south of it rows of new houses begin to line up. The town grows thicker north and south from the east-west street, and the fields between it and the river at the top still spread as large areas. At the mill, operation with automatic reeling machines installed after the war continued in this period as well.
From the end of operation to World Heritage
As the silk-reeling industry in Japan shrank, the mill stopped operating in March 1987. Katakura Industries kept preserving most of the buildings even after it stopped, and in July 2005 the site became a national Historic Site, and in July 2006 the buildings from the founding period became national Important Cultural Properties. In June 2014 it was inscribed on the World Heritage List as "Tomioka Silk Mill and Related Sites", and in December of the same year the three buildings, the silk-reeling hall and the east and west cocoon warehouses, were designated National Treasures. More than 100 buildings remain on the premises, and the City of Tomioka owns and manages the site.
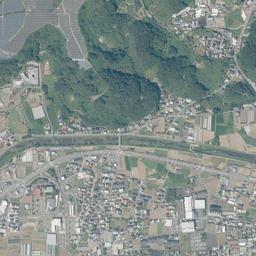
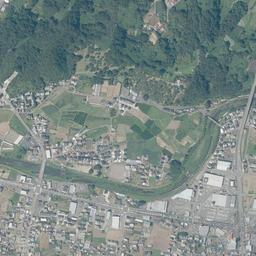
In today's photograph too, the long buildings of the silk mill form the squared U shape in the same position and facing the same way as in 1961-69. The street running east-west through the center of the frame is also on the same line, and the framework of the town itself has hardly moved from the two eras to today's photograph. The change is in the area around it. West of the mill, a wide road running straight north-south crosses the Kabura River by a bridge and continues to the town in the south. On the east side of the town, several large flat-roofed buildings and wide paved surfaces can be seen, and lots of a different size are mixed in among the rows of small roofs. An east-west road extends along the river at the top, and many of the fields that remained between the town and the river have turned into building sites. On the mountain slopes to the north, surfaces lined with solar panels have appeared. South of the river the rows of houses are almost continuous, and the lots of fields remain only as bands at the lower left and the lower center. The Kabura River keeps the same bends as in the two earlier eras, but the white of the riverbed has decreased, and green covers the banks. The assumptions for when the water rises in the area near the Kabura River are shown on the hazard map of the City of Tomioka.
In a residential area of Nanokaichi, about 490 m from the silk mill, the official land prices (Chika Koji) up to the 2026 publication are highest at 77,900 yen per square meter in 1992 and lowest at 29,500 yen in 2026. Between the two eras when the mill was reeling silk and today, when it is open to the public as a cultural property, much of the surrounding scenery has been replaced. Even so, at the southern edge of the town, the layout of the buildings set on the former site of the administrative compound at the founding remains just as it was.