Yubari (Coal Mining Town) about 60 years ago and today
Then and now
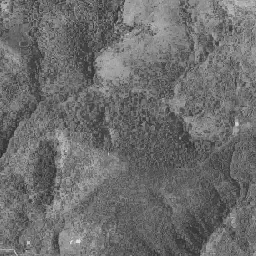
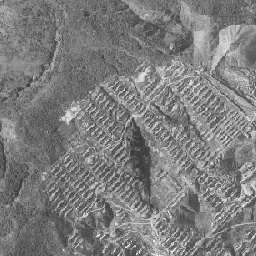
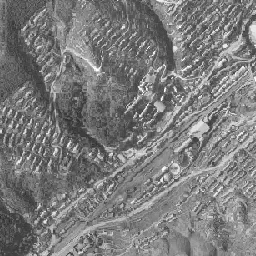
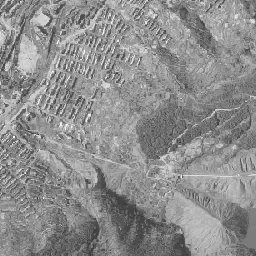
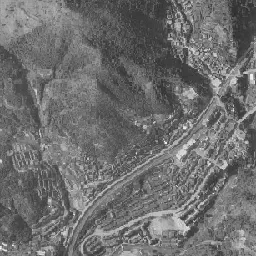
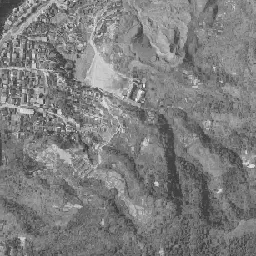
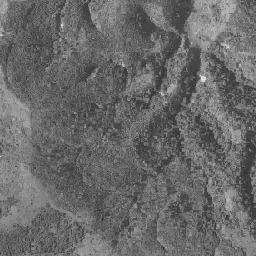
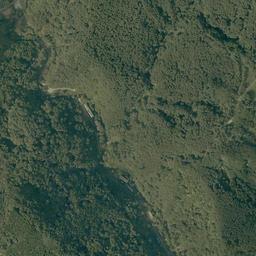
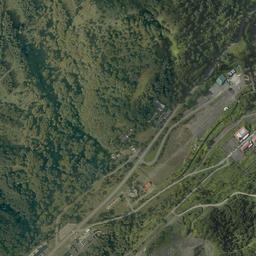
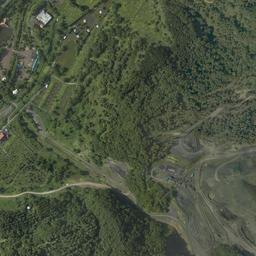
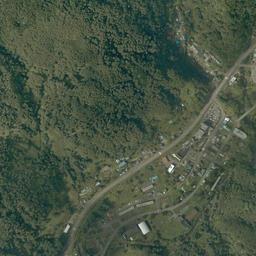
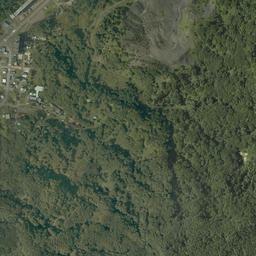




Center photograph taken: July 1966
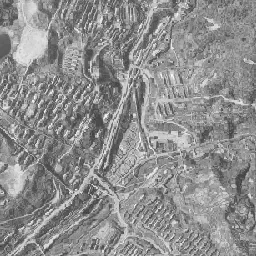
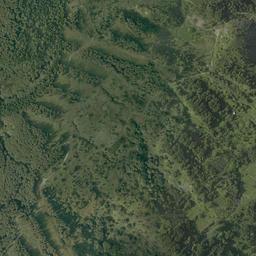
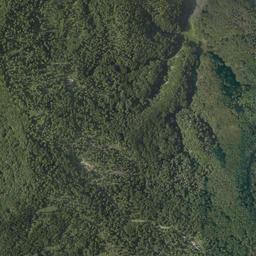
What to compare in this era: In the upper half of the frame, look at the lines of row houses lined up along the contour lines. If you step to 1974-78, much of the same slope has turned into pale grassland
Controls: drag to move / right-drag to rotate and tilt / scroll while holding ⌘ or Ctrl to zoomControls: slide with two fingers to move / pinch to zoom / drag two fingers up or down to tilt
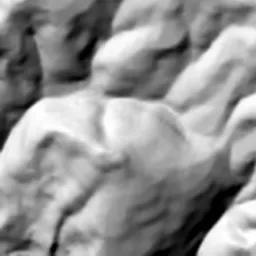
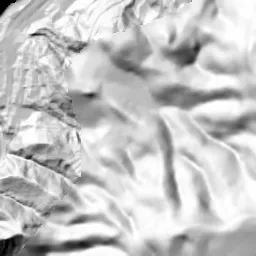
Note: the 3D elevation data is based on current surveys, not on the terrain at the time of the photograph. Elevation tiles: processed from GSI Tiles
The 3D view could not be loaded. Check your connection and try again.
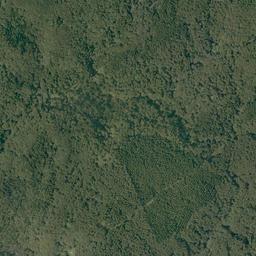
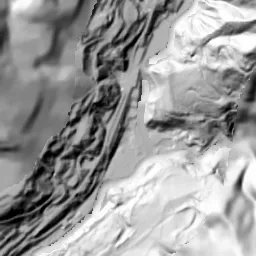
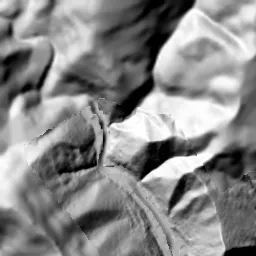
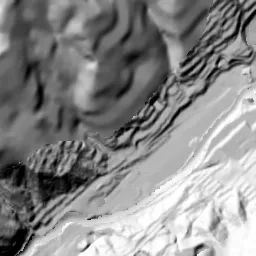
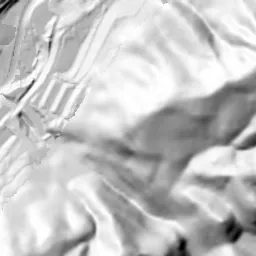
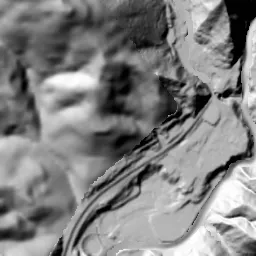
Note: the terrain shading is based on current surveys, not on the terrain at the time of the photograph. Hillshade map: processed from GSI Tiles
Note: the map is today's, not a map from the time of the photograph. Map: © OpenStreetMap contributors
Source: processed from GSI Tiles (aerial photographs by era / latest nationwide photographs / single photographs)
Explore this area on the mapMove the map to compare the surroundings then and now as well.
Overlay and compare the 1961-1969 aerial photograph and today's photograph of the Yubari (Coal Mining Town) area, Hokkaido. All photographs are published by the Geospatial Information Authority of Japan (GSI).
Eras of photographs for this location
For the Yubari (Coal Mining Town) area, aerial photographs from the following eras can be compared.
The old photographs of this location cover 2 eras from 1961-1969 to 1974-1978; as of 2026, the newest photograph, 1974-1978, is 48-52 years ago.There are no photographs of this location from after that until today. The differences between eras are summarized in the guide to aerial photograph eras.
Coverage for each era differs by region. Only the eras that actually have photographs of this location are listed here.
Elevation of this location
The elevation (above sea level) at the reference point of Yubari (Coal Mining Town) is 350.9 m (source: GSI elevation API). Elevation profiles running east-west and north-south through this location are also shown.
Profile positions (vertical green line = north-south / horizontal blue line = east-west)
Elevation is the value at the ground surface (even where a station is underground or elevated, the value is for the ground surface). Elevation is only one factor in disaster preparedness. Check actual risks such as flooding on the Hazard Map Portal Site and the hazard maps published by local governments.
Elevation tiles for the profiles: processed from GSI Tiles
Access by rail
One of the nearest stations to Yubari (Coal Mining Town) is Shin-Yubari Station, served by the following lines.
- JR Hokkaido Sekisho Line
Source of line information: processed from National Land Numerical Information (Railway Data / Ministry of Land, Infrastructure, Transport and Tourism).
Change seen in the share of built-up area
This compares land use in 1976 and 2021. The share of built-up area within 500 m changed from 29% to 21%. Among the locations on this site, the spread of built-up area here is among the smallest (bottom 20%). The bar below shows where this location falls in the distribution across the locations on this site.
Source: processed from National Land Numerical Information (Land Use Subdivision Mesh / 1976 and 2021 / Ministry of Land, Infrastructure, Transport and Tourism). The texture value (amount of fine detail) of the photographs changed from 18.1 to 20.9. This is a mechanical comparison between photographs and includes differences from the shooting season and from black and white versus color, so treat it only as a rough guide.
Official land prices over time
The official land price (Chika Koji) standard site nearest to this location is "1-118-12 Shimizusawa, Yubari, Hokkaido" (about 7.4 km in a straight line; use: Residential). The official prices per square meter at this standard site from 2002 to 2026 are shown below. The 2026 official price is 2,400 yen.
View as a table
| Year | Official price |
|---|---|
| 2002 | 7,400 yen |
| 2003 | 7,200 yen |
| 2004 | 7,100 yen |
| 2005 | 7,100 yen |
| 2006 | 7,100 yen |
| 2007 | 6,600 yen |
| 2008 | 6,000 yen |
| 2009 | 5,500 yen |
| 2010 | 5,100 yen |
| 2011 | 4,800 yen |
| 2012 | 4,500 yen |
| 2013 | 4,300 yen |
| 2014 | 4,200 yen |
| 2015 | 4,000 yen |
| 2016 | 3,700 yen |
| 2017 | 3,500 yen |
| 2018 | 3,300 yen |
| 2019 | 3,200 yen |
| 2020 | 3,000 yen |
| 2021 | 2,900 yen |
| 2022 | 2,800 yen |
| 2023 | 2,700 yen |
| 2024 | 2,600 yen |
| 2025 | 2,500 yen |
| 2026 | 2,400 yen |
Source: processed from National Land Numerical Information (Land Price Publication Data / Ministry of Land, Infrastructure, Transport and Tourism). Official land prices are values published for standard sites as of January 1 each year and do not show the transaction price of any particular piece of land. The selection and location of standard sites may be reviewed from year to year.
Nearby locations
Sorted by distance from Yubari. Comparing them together shows how the same area has changed over time.
Select a marker on the map to see the location name and a link to it.
Locations with the same origins
Towns in the same category as Yubari (Former factory site), chosen from other regions. You can compare what they share in land use and town layout.
Select a marker on the map to see the location name and a link to it.
Recently viewed towns
This history is saved only on your device and is not sent to any server. Depending on your browser settings, it may be deleted automatically if you do not visit for a while (it is less likely to be deleted if you use the site as an app).
Why not look at how another town has changed?
History of Yubari (Coal Mining Town)
Yubari is a town that was opened to mine coal. Tributaries of the Yubari River carve deeply into the mountains, flat land remains only as thin strips on the valley floors, and into those narrow floors were packed the pit mouths, tracks, and plants, and onto the slopes on both sides the homes of the people who worked there. This frame captures a section where the valley runs diagonally from the lower left to the upper right. The aerial photographs that survive are those of 1961-69 and 1974-78, and if you lay today's photograph over them, you can read the order in which the rows of housing that filled the mountain slopes faded and returned to forest.
A coal capital that began from an outcrop
According to the history compiled in a plan of the City of Yubari, the beginning was in 1888. Saka Ichitaro, an engineer of the Hokkaido Government, found a large outcrop of the Yubari Coalfield. In 1891 the Hokkaido Colliery and Railway Company opened the Yubari No. 1 Mine, and the following year a railway linking Oiwake and Yubari opened. The town swelled as a base for sending high-quality coal out to the rest of the country, and it adopted city status in 1943. The city's materials record that at its peak in 1960 there were more than 17 coal mines, producing 4 million tons a year. The 107,972 people counted in the national census of the same year, 1960, are the peak of this city's population.
The landform decided the shape of the town. More than 90% of the city's area is forest and wild land, and the places where people live extend in bands along the river and its tributaries. If the tracks and facilities take up the valley floor, the only option for homes is to cut steps into the slopes above and line them up there. The left side and lower right of the frame are ridges covered by forest, and from there the slopes fall to the valley floor at the center. The homes stood on the upper half of the slopes, which opens on the north side of the valley, and on the shoulder toward the right.
Lines of row houses filling the slopes
In the 1961-69 photograph, the slopes on both sides of the valley are covered with small roofs of the same shape. In the upper half of the frame, short row houses stand in dozens of parallel rows, as if following the contour lines, and climb up to near the shoulders of the ridges. At the center of the frame there is a small hill thick with dark growth, and the rows of houses wrap around its foot. Only the top of the small hill is left as forest, and housing surrounds it. In the middle on the right, too, gridded housing spreads together over a gentle slope. On the valley floor many tracks run diagonally in a bundle, and a road and the river keep close to them. The mountain on the left is dense forest, another thin valley runs down through it, and in the lower left corner it joins a town area packed with rows of houses. In the middle of the right edge, a whitish slope with no trees shows. At the bottom center of the frame, a little above the valley floor, there is a square, open, bright flat area, and several fairly large buildings stand beside it. The amount of housing lined up on the slopes is far greater than that of the town area on the valley floor.
By 1974-78, many of the lines of row houses that lined the upper half of the slopes have disappeared. The mountains are a mottled mix of the brown of autumn leaves and the dark green of evergreens. The places where roofs stood have become pale yellow-green grassland, and only the lines of the stepped lots remain faintly. The rows of houses that went around the foot of the small hill at the center are broken too, and they have begun to be covered with grass and young trees. The remaining homes are gathered at the upper right and the middle on the right, and there buildings longer than in the previous era line up facing the same way. On the valley floor, buildings with red roofs gather beside the tracks, and to the south of them a wide, dark gray area of ground opens up. In the middle of the right edge, a gray cone-shaped mound with radiating streaks spreads its base. The town area at the lower left is as packed with rows of houses as in the previous era, with blue and white roofs mixed in. From the middle on the left a single road runs down along the thin valley, small roofs continue here and there along it, and it connects to the town area at the lower left.
The forest that returned after the mines closed
The city's materials write that from 1961 on, coal mines closed one after another because of the shift in energy, and from 1973 on, major mines including the Hokutan Yubari Coal Mine also closed. The 1974-78 photographs were taken during that period of continuing closures. In October 1987 the Hokutan Mayachi Coal Mine closed, and on March 27, 1990, the last mine, the Mitsubishi Minami-Oyubari Coal Mine, closed, and the industry of mining coal disappeared from the city. The census population fell to 31,665 by 1985, and in the Basic Resident Register it was 7,744 at the end of March 2020. On April 1, 2019, the JR Sekisho Line between Shin-Yubari Station and Yubari Station was abolished, and the nearest station became Shin-Yubari Station, far to the south.
As a new pillar in place of coal, the city staked its future on tourism. It built facilities such as the "Coal History Village" on former mine sites and held a series of events such as film festivals. However, the costs of dealing with the aftermath of the closures and the investment in tourism piled up and the deficit swelled, and in June 2006 the city announced that it was giving up on rebuilding its finances on its own. From fiscal 2007, efforts under a financial rebuilding plan based on law began. The population began to fall faster from this period, and the process by which signs of people vanished from the valley slopes did not end with the single event of the mine closures.
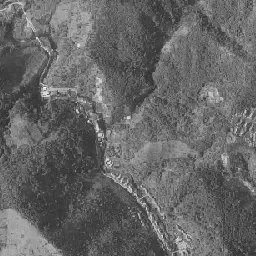
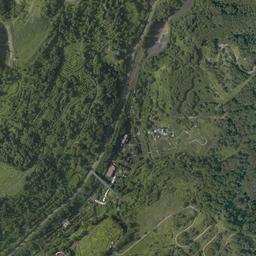
The forest covers almost the whole of the slopes, and in today's photograph hardly any roofs can be seen even on the upper half, where lines of row houses stood in 1961-69. Still, horizontal streaks float up faintly in the way the tree heights line up, passing on the traces of the lots cut into steps. The slopes people left were covered with trees in about half a century. A diagonal road passes along the valley floor, and beside it buildings with red and white roofs stand here and there. At the upper right there is a road that climbs the slope while doubling back. Where the cone-shaped mound spread its base in the middle of the right edge, gray bare soil remains, and a road winds through it. The ground that was dark gray at the bottom center of the frame is also still gray bare ground, surrounded by forest.
The town area at the lower left has far fewer buildings, but the way its roads bend is the same as in the two eras. The directions of the road and the river on the valley floor also trace the same diagonal line as the bundle of tracks in 1961-69. Only the framework of the town decided by the landform remains, and the layer of homes that sat on it has peeled away. The size of the coal mining town was carved not on the valley floor but on the side of the slopes.