Iida Station Area about 60 years ago and today
Then and now
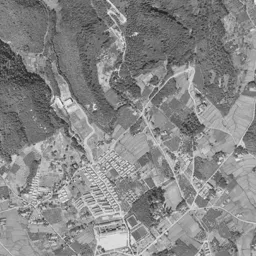
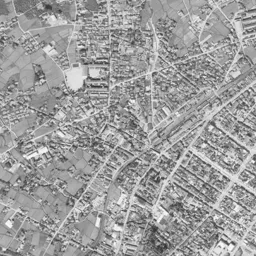
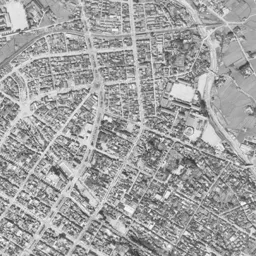
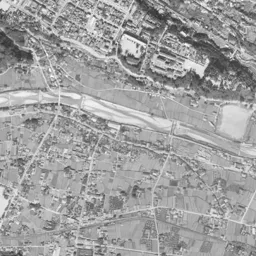
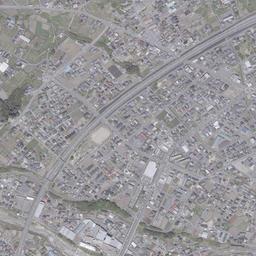
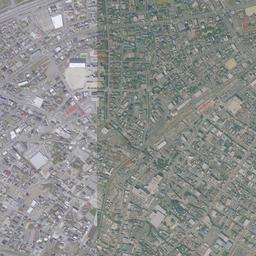
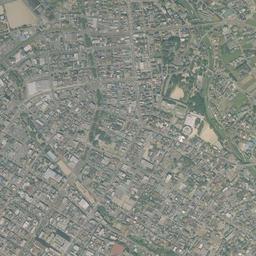
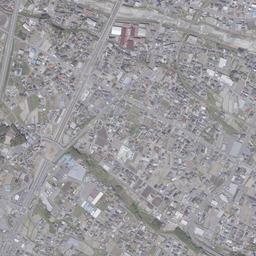
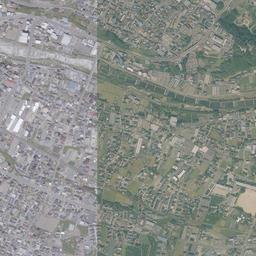
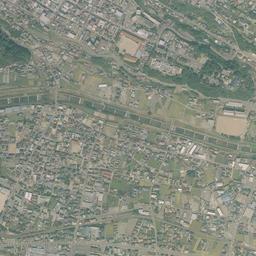


Center photograph taken: October 1965
What to compare in this era: No vacant lots can be found in the grid east of the tracks, and to the west the rows of houses are thin. If you compare it with today's photograph, you can see that the west side has also filled to the same density
Controls: drag to move / right-drag to rotate and tilt / scroll while holding ⌘ or Ctrl to zoomControls: slide with two fingers to move / pinch to zoom / drag two fingers up or down to tilt
Note: the 3D elevation data is based on current surveys, not on the terrain at the time of the photograph. Elevation tiles: processed from GSI Tiles
The 3D view could not be loaded. Check your connection and try again.
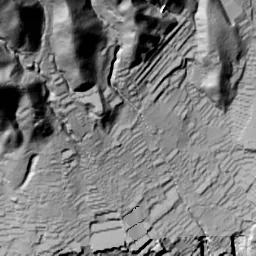
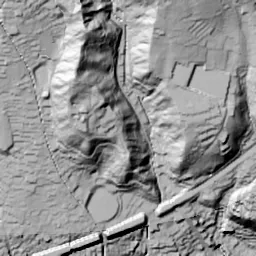
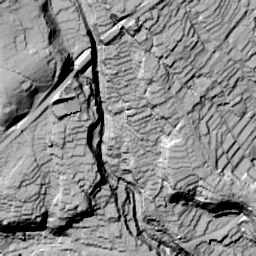
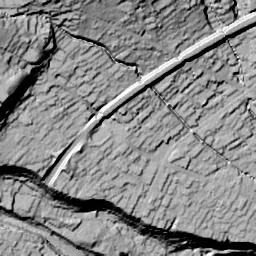
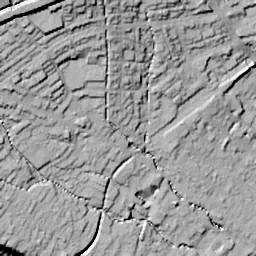
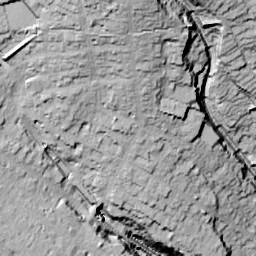
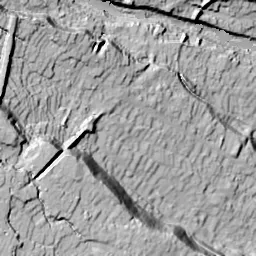
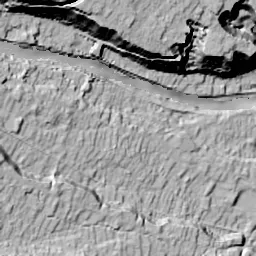
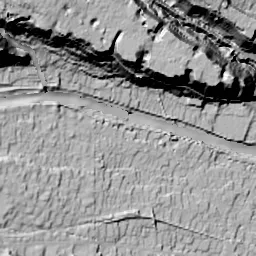
Note: the terrain shading is based on current surveys, not on the terrain at the time of the photograph. Hillshade map: processed from GSI Tiles
Note: the map is today's, not a map from the time of the photograph. Map: © OpenStreetMap contributors
Source: processed from GSI Tiles (aerial photographs by era / latest nationwide photographs / single photographs)
Explore this area on the mapMove the map to compare the surroundings then and now as well.
Overlay and compare the 1961-1969 aerial photograph and today's photograph of the Iida Station Area area, Nagano Prefecture. All photographs are published by the Geospatial Information Authority of Japan (GSI).
Eras of photographs for this location
For the Iida Station Area area, aerial photographs from the following eras can be compared.
The old photographs of this location cover 2 eras from 1961-1969 to 1974-1978; as of 2026, the newest photograph, 1974-1978, is 50 years ago.There are no photographs of this location from after that until today. The differences between eras are summarized in the guide to aerial photograph eras.
Coverage for each era differs by region. Only the eras that actually have photographs of this location are listed here.
Elevation of this location
The elevation (above sea level) near Iida Station is 509.1 m (source: GSI elevation API). Elevation profiles running east-west and north-south through this location are also shown.
Profile positions (vertical green line = north-south / horizontal blue line = east-west)
Elevation is the value at the ground surface (even where a station is underground or elevated, the value is for the ground surface). Elevation is only one factor in disaster preparedness. Check actual risks such as flooding on the Hazard Map Portal Site and the hazard maps published by local governments.
Elevation tiles for the profiles: processed from GSI Tiles
Access by rail
Iida Station is served by the following lines.
- JR Central Iida Line
Source of line information: processed from National Land Numerical Information (Railway Data / Ministry of Land, Infrastructure, Transport and Tourism).
Change seen in the share of built-up area
This compares land use in 1976 and 2021. The share of built-up area within 500 m changed from 100% to 92%. Among the locations on this site, the spread of built-up area here is among the smallest (bottom 20%). The bar below shows where this location falls in the distribution across the locations on this site.
Source: processed from National Land Numerical Information (Land Use Subdivision Mesh / 1976 and 2021 / Ministry of Land, Infrastructure, Transport and Tourism). The texture value (amount of fine detail) of the photographs changed from 16.9 to 23. This is a mechanical comparison between photographs and includes differences from the shooting season and from black and white versus color, so treat it only as a rough guide.
Official land prices over time
The official land price (Chika Koji) standard site nearest to this location is "151-7 Kamisato Kuroda, Iida, Nagano Prefecture" (about 1.3 km in a straight line; use: Residential). The official prices per square meter at this standard site from 1995 to 2026 are shown below. The 2026 official price is 29,900 yen.
View as a table
| Year | Official price |
|---|---|
| 1995 | 52,000 yen |
| 1996 | 52,600 yen |
| 1997 | 52,900 yen |
| 1998 | 53,000 yen |
| 1999 | 52,500 yen |
| 2000 | 50,900 yen |
| 2001 | 49,300 yen |
| 2002 | 46,600 yen |
| 2003 | 44,400 yen |
| 2004 | 42,400 yen |
| 2005 | 40,400 yen |
| 2006 | 38,600 yen |
| 2007 | 37,100 yen |
| 2008 | 36,200 yen |
| 2009 | 35,200 yen |
| 2010 | 34,000 yen |
| 2011 | 32,700 yen |
| 2012 | 31,800 yen |
| 2013 | 31,000 yen |
| 2014 | 30,300 yen |
| 2015 | 29,900 yen |
| 2016 | 29,900 yen |
| 2017 | 29,900 yen |
| 2018 | 29,900 yen |
| 2019 | 29,900 yen |
| 2020 | 29,900 yen |
| 2021 | 29,900 yen |
| 2022 | 29,900 yen |
| 2023 | 29,900 yen |
| 2024 | 29,900 yen |
| 2025 | 29,900 yen |
| 2026 | 29,900 yen |
Source: processed from National Land Numerical Information (Land Price Publication Data / Ministry of Land, Infrastructure, Transport and Tourism). Official land prices are values published for standard sites as of January 1 each year and do not show the transaction price of any particular piece of land. The selection and location of standard sites may be reviewed from year to year.
Nearby locations
Sorted by distance from Iida Station Area. Comparing them together shows how the same area has changed over time.
Select a marker on the map to see the location name and a link to it.
Locations with the same origins
Towns in the same category as Iida Station Area (Redevelopment), chosen from other regions. You can compare what they share in land use and town layout.
Select a marker on the map to see the location name and a link to it.
Recently viewed towns
This history is saved only on your device and is not sent to any server. Depending on your browser settings, it may be deleted automatically if you do not visit for a while (it is less likely to be deleted if you use the site as an app).
Why not look at how another town has changed?
History of Iida Station Area
The center of Iida sits on a river terrace in the Ina Basin. It is a downtown that continued as the castle town of Iida Castle and has been called a "Little Kyoto" for the look of its streets. Iida Station is on the northwestern edge of that downtown, and the tracks pass diagonally over the terrace from northeast to southwest. In the southern part of the aerial photographs, the Matsu River, spreading a riverbed of white gravel, flows from west to east, and on its north bank a dark band of woods traces the edge of the terrace. The positional relationship of these three, the station, the river and the edge of the terrace, does not change through the aerial photographs of two eras and today's photograph. The change is in the fields that surrounded the outside of the downtown, and in one large road that cut in among them.
On top of a burned castle town
To tell the story of how this town looks, it is necessary to start from two fires before the photographs. According to the chronology of the City of Iida, there was a great fire in front of Iida Station in July 1946, and in April of the following year, 1947, a great fire broke out that burned two-thirds of the downtown. This means that two-thirds of the rows of houses built up as a castle town were lost in succession in less than a year.
For the reconstruction, the city decided as its city plan on firebreak roads dividing the town into four and urakaisen back alleys. It is the idea of dividing the downtown with wide roads so that fire does not spread across the whole town. The Ringo Namiki (the name means apple tree avenue) began when students of Iida Higashi Junior High School planted apple trees in the central planting strip of those firebreak roads, and the chronology gives November 1953 as the start of the planting. The avenue marked its 40th anniversary in 1993. Greenery raised by the citizens was thus built into the streets redrawn from the burned ruins.
The railway had passed over this terrace since before then. The lines of the Ina Electric Railway and others were combined into the Iida Line in August 1943. The City of Iida itself was born in April 1937 when Iida Town and Kami-Iida Town merged.
A tilted grid and a white riverbed
It is the 1961-69 aerial photograph that shows the town more than 14 years after the great fires, and no blank that suggests burned ruins can be found anywhere in the frame. A dark band runs diagonally through the middle of the frame from northeast to southwest, recognizable as the tracks and the station yard. On its east side, a grid of streets tilted at an angle is filled completely with rows of houses, taking up most of the right half of the frame. The orientation of the grid is almost parallel to the tracks, and just east of the yard a single road draws a large arc into the grid. By contrast, the rows of houses on the west side of the tracks are thin, and a little farther away they change into lots of paddies and fields with scattered farmhouses.
A little more than 14 years after 1947 in the chronology, the grid east of the tracks had been filled without leaving a single vacant lot.
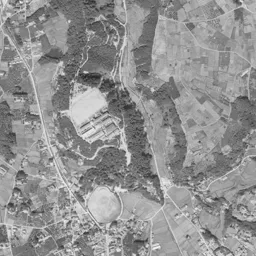
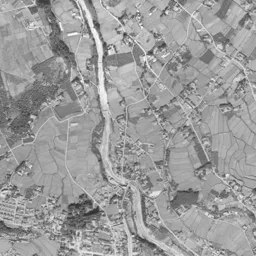
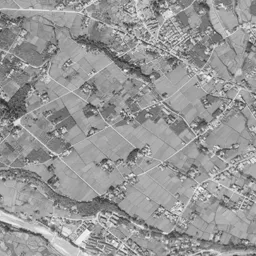
In this era the Matsu River, flowing in the southern part of the frame, spreads a wide riverbed of gravel shining white, and the streams of water flow in thin branches within the riverbed. On the north bank, black woods continue in a band, and the rows of houses of the downtown break off just short of that band. The position of the band is the edge of the terrace, the border between the high surface on which the town sits and the low surface of the river. The south bank is spread with paddies, fields and settlements, and the difference from the dense grid on the north bank is clear. In the upper half of the frame, the foot of the mountains and woods press close, and in front of them an oval sports ground and long buildings that look like school buildings line up. From the upper right to the right edge, another thin river carves a valley as it descends.
The height of the ground is highest in the west and north and falls toward the east and south. The surface of the terrace itself tilts gently toward the river, and the side closer to the river is lower. The hazard map made by the City of Iida shows how the slopes at the edge of the terrace and the low surfaces along the river are treated.
An arc curving around the north and west
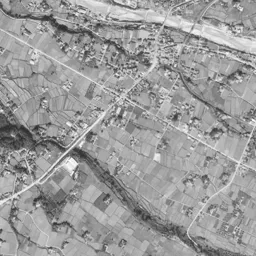
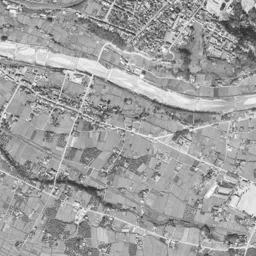
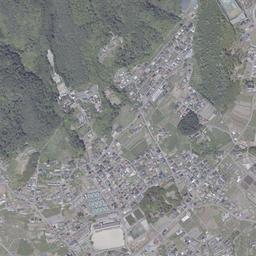
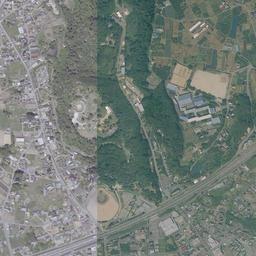
An arc of a wide road, tracing the foot of the mountains to the north from the upper right of the frame, curving around the west and passing out to the lower left, appears for the first time in the 1974-78 photograph. In 1961-69 there were only paddies, fields and woods in this place. The chronology records the stake-driving ceremony of the Chuo Expressway in October 1966 and the opening of the section between Nakatsugawa and Komagane in August 1975. The arc does not touch the grid of the downtown at all, and was drawn so as to wrap the town on the terrace from the outside. You also notice that the paddies and fields remain differently inside and outside the arc. On the western side inside, roofs are beginning to increase, and outside, green lots are still wide.
The Matsu River in the same era looks thin between green banks, and the width of the white riverbed is much narrower than in 1961-69. The band of woods on the north bank remains in the same position, and the southern edge of the downtown has not moved either. There is no notable change in the grid in the center either; the change is only outside the grid.
There are other things that kept their positions. The oval sports ground at the top center of the frame is in the same place from 1961-69 to today's photograph, and from 1974-78 the arc road passes just grazing its south side. The white square that looks like a schoolyard at the foot of the mountains in the upper left, and the valley of the thin river in the upper right edged by woods, also barely change their outlines. The new road was drawn threading through the gaps between these existing facilities and the terrain.
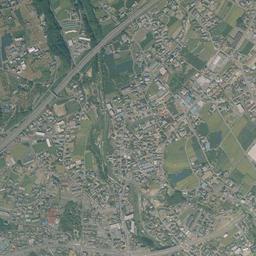
The arc road runs in the same position in today's photograph too, and many of the paddies and fields that spread on the western side inside it have been replaced by rows of houses and large roofs. The composition in which the rows of houses were thin west of the tracks has disappeared, and both sides of the station have the same density. In the upper right inside the arc, lots of green and brown fields remain in a small cluster. At the lower right of the frame, the Matsu River is held between straight embankments on both banks, and the white riverbed has changed into a thin gray band. The band of woods on the north bank remains in almost the same shape as in 1961-69, and the edge of the terrace continues to be the southern border of the town.
The residential land in Kamisato Kuroda is in a district of the former Kamisato Town, which merged into the City of Iida in July 1993, about 1,299 m from the station. If you trace the land price here up to the 2026 official land prices (Chika Koji), 53,000 yen per square meter in 1998 is the highest, and 29,900 yen in each year from 2015 to 2026 is the cheapest.