Asuto Nagamachi about 60 years ago and today
Then and now
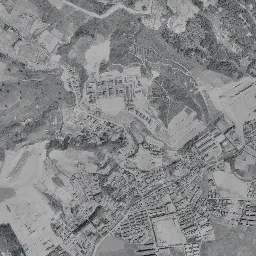
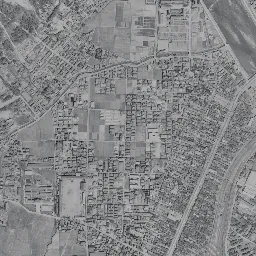
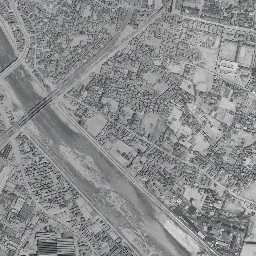
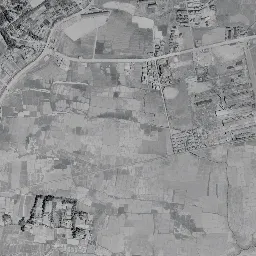
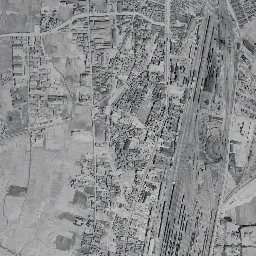
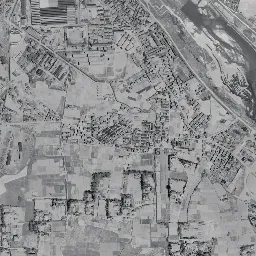
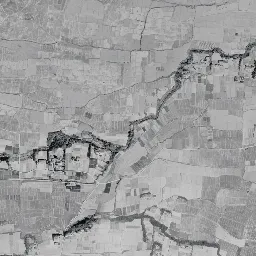
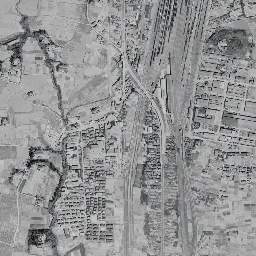
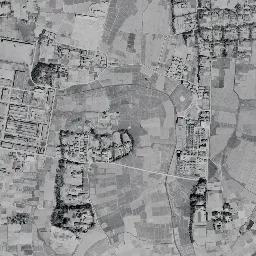
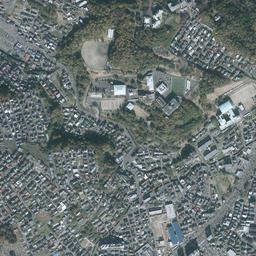
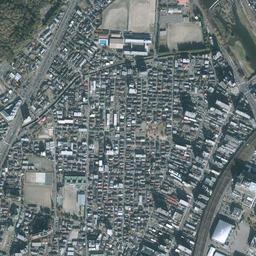
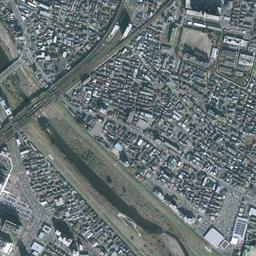
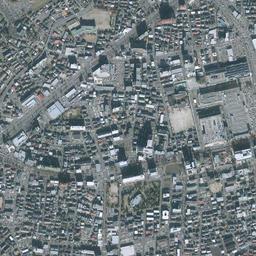
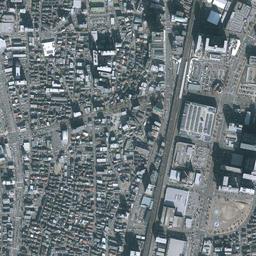
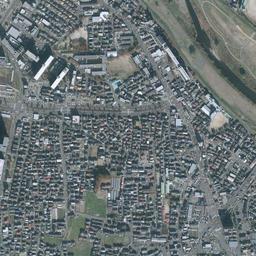
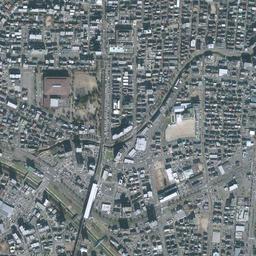
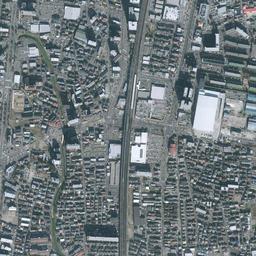
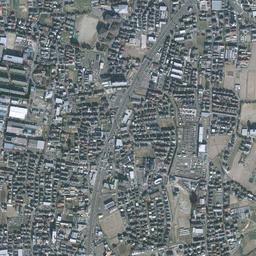
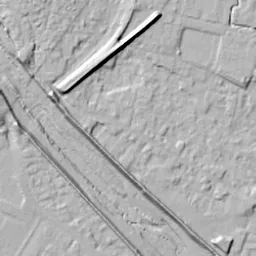
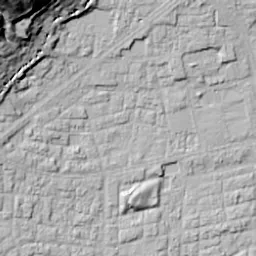
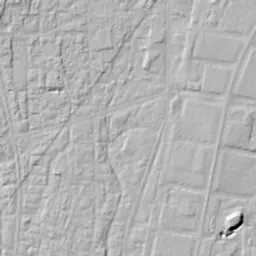
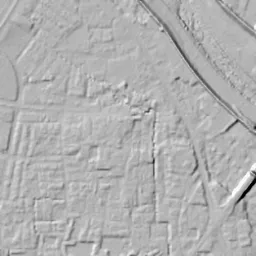


Center photograph taken: 1961-68
What to compare in this era: The stripes of the sidings run through two thirds of the frame from top to bottom. The edge of the farmland remaining in the lower part of the western half is the boundary of the town at the time
Controls: drag to move / right-drag to rotate and tilt / scroll while holding ⌘ or Ctrl to zoomControls: slide with two fingers to move / pinch to zoom / drag two fingers up or down to tilt
Note: the 3D elevation data is based on current surveys, not on the terrain at the time of the photograph. Elevation tiles: processed from GSI Tiles
The 3D view could not be loaded. Check your connection and try again.
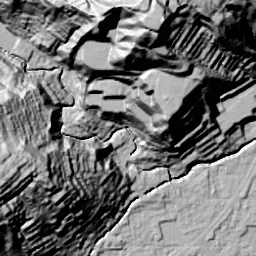
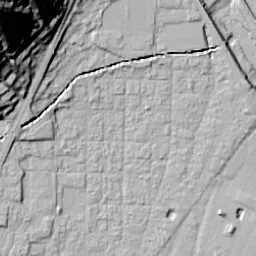
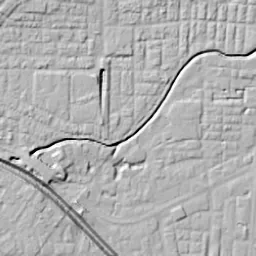
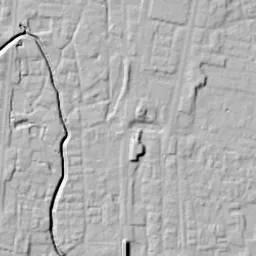
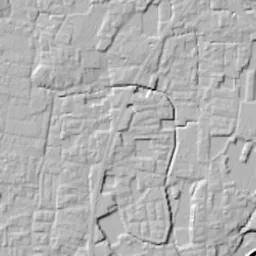
Note: the terrain shading is based on current surveys, not on the terrain at the time of the photograph. Hillshade map: processed from GSI Tiles
Note: the map is today's, not a map from the time of the photograph. Map: © OpenStreetMap contributors
Source: processed from GSI Tiles (aerial photographs by era / latest nationwide photographs / single photographs)
Explore this area on the mapMove the map to compare the surroundings then and now as well.
Overlay and compare the 1961-1969 aerial photograph and today's photograph of the Asuto Nagamachi area, Miyagi Prefecture. All photographs are published by the Geospatial Information Authority of Japan (GSI).
Eras of photographs for this location
For the Asuto Nagamachi area, aerial photographs from the following eras can be compared.
The old photographs of this location cover 4 eras from 1945-1950 to 1984-1986; as of 2026, the newest photograph, 1984-1986, is 42 years ago.There are no photographs of this location from after that until today. The differences between eras are summarized in the guide to aerial photograph eras.
Coverage for each era differs by region. Only the eras that actually have photographs of this location are listed here.
Elevation of this location
The elevation (above sea level) near Nagamachi Station is 11.1 m (source: GSI elevation API). Elevation profiles running east-west and north-south through this location are also shown.
Profile positions (vertical green line = north-south / horizontal blue line = east-west)
Elevation is the value at the ground surface (even where a station is underground or elevated, the value is for the ground surface). Elevation is only one factor in disaster preparedness. Check actual risks such as flooding on the Hazard Map Portal Site and the hazard maps published by local governments.
Elevation tiles for the profiles: processed from GSI Tiles
Access by rail
Nagamachi Station is served by the following lines.
- Sendai Subway Namboku Line
- JR East Tohoku Line
Source of line information: processed from National Land Numerical Information (Railway Data / Ministry of Land, Infrastructure, Transport and Tourism).
Change seen in the share of built-up area
This compares land use in 1976 and 2021. The share of built-up area within 500 m changed from 100% to 87%. Among the locations on this site, the spread of built-up area here is among the smallest (bottom 20%). The bar below shows where this location falls in the distribution across the locations on this site.
Source: processed from National Land Numerical Information (Land Use Subdivision Mesh / 1976 and 2021 / Ministry of Land, Infrastructure, Transport and Tourism). The texture value (amount of fine detail) of the photographs changed from 15.6 to 40.4. This is a mechanical comparison between photographs and includes differences from the shooting season and from black and white versus color, so treat it only as a rough guide.
Official land prices over time
The official land price (Chika Koji) standard site nearest to this location is "4-250-5 Nagamachi, Taihaku Ward, Sendai, Miyagi Prefecture" (about 405 m in a straight line; use: Residential). The official prices per square meter at this standard site from 1989 to 2026 are shown below. The 2026 official price is 269,000 yen.
View as a table
| Year | Official price |
|---|---|
| 1989 | 135,000 yen |
| 1990 | 177,000 yen |
| 1991 | 225,000 yen |
| 1992 | 222,000 yen |
| 1993 | 208,000 yen |
| 1994 | 193,000 yen |
| 1995 | 185,000 yen |
| 1996 | 179,000 yen |
| 1997 | 169,000 yen |
| 1998 | 162,000 yen |
| 1999 | 153,000 yen |
| 2000 | 145,000 yen |
| 2001 | 139,000 yen |
| 2002 | 133,000 yen |
| 2003 | 128,000 yen |
| 2004 | 124,000 yen |
| 2005 | 123,000 yen |
| 2006 | 123,000 yen |
| 2007 | 126,000 yen |
| 2008 | 131,000 yen |
| 2009 | 130,000 yen |
| 2010 | 125,000 yen |
| 2011 | 123,000 yen |
| 2012 | 123,000 yen |
| 2013 | 127,000 yen |
| 2014 | 130,000 yen |
| 2015 | 134,000 yen |
| 2016 | 139,000 yen |
| 2017 | 144,000 yen |
| 2018 | 156,000 yen |
| 2019 | 171,000 yen |
| 2020 | 190,000 yen |
| 2021 | 198,000 yen |
| 2022 | 210,000 yen |
| 2023 | 224,000 yen |
| 2024 | 238,000 yen |
| 2025 | 253,000 yen |
| 2026 | 269,000 yen |
Source: processed from National Land Numerical Information (Land Price Publication Data / Ministry of Land, Infrastructure, Transport and Tourism). Official land prices are values published for standard sites as of January 1 each year and do not show the transaction price of any particular piece of land. The selection and location of standard sites may be reviewed from year to year.
Nearby locations
Sorted by distance from Asuto Nagamachi. Comparing them together shows how the same area has changed over time.
Select a marker on the map to see the location name and a link to it.
Locations with the same origins
Towns in the same category as Asuto Nagamachi (Former factory site), chosen from other regions. You can compare what they share in land use and town layout.
Select a marker on the map to see the location name and a link to it.
Articles that feature this location
Recently viewed towns
This history is saved only on your device and is not sent to any server. Depending on your browser settings, it may be deleted automatically if you do not visit for a while (it is less likely to be deleted if you use the site as an app).
Why not look at how another town has changed?
History of Asuto Nagamachi
About 3 km south of central Sendai lies a town called Nagamachi. It is in the middle of the plain between the Hirose River and the Natori River; within the frame, the highest measurement point, to the east, is 12.0 m, and the lowest, to the south, is 10.4 m. The center is 11.1 m, the north 11.8 m and the west 11.3 m, so wherever you measure, it all fits within a range of 1.6 m. This is also land crossed by a highway heading south, and it has a history of rows of houses extending as a post town along the highway. On flat land running long and narrow, the highway and the railway that came later overlapped in the same direction. That is the framework of this location.
A rail yard that sorts freight cars needs a long stretch of flat, narrow land. Receiving up and down trains, regrouping them by destination and sending them off requires a far larger area than the grounds of a passenger station. This area, a little south of the Sendai town center, where a straight site could be secured all at once among the fields, met that condition. The tracks were laid in the same north-south direction as the highway, and from then on the way this land was used came to be decided around two parallel lines, the highway and the railway.
A frame showing a bundle of sidings
If you open the 1945-50 aerial photograph, the frame clearly divides into a left half and a right half of different character. The western half is fields all over, and settlements holding household woods float here and there among strip-shaped lots. The direction of the lots differs slightly from place to place, and in some places they bend to follow the course of the waterways. In the northwest corner there is a forest on the hills, and fields come down from its foot. The center and east are different. A long, narrow row of houses extends north-south along the highway, and just east of it a band of dozens of thin lines bundled together runs vertically. It is the rail yard that sorts freight cars. The shape of the lines gathering and dividing again can be read in the photograph. In the northeast of the frame a river with a wide riverbed flows diagonally, and on its far bank too there are town blocks and buildings with large roofs. Toward the bottom of the center, a large lot with long, narrow buildings lined up neatly appears.
If you switch to 1961-69, the density of roofs in the northern half rises first. The rows of houses that were along the highway swell sideways and fill in between the fields. Even so, wide farmland still remains in the lower part of the western half, and you can clearly see where the edge of the town lies in the frame. The rail yard looks longer and thicker than in the previous era. Stripes of parallel sidings run through two thirds of the frame from top to bottom, and a band of nothing but tracks lies in the midst of the town. An embankment and a road on top of it run along the river. The large factory lot toward the northeast, with fine stripes on its roofs, also appears in the same place in the photograph of the previous era. In this era the striped surface is especially bright, and with more buildings around it the outline of the site becomes clear.
A spindle-shaped band
From the 1974-78 photograph, color comes into the frame. Under a yellow-green tint, the rail yard stands out in the center of the frame as a brown spindle shape. It is narrowed at both ends and widest in the middle, and the figure of a yard where freight cars are pushed up and sorted by gravity looks just like a plan drawing. Grains of varying shades line the sidings, and you can read that freight cars are being held there. If you look around, buildings with red roofs stand together in the town on the east side, and in the lower half of the west, wide fields still spread out in ocher. Along the river flowing in the northeast of the frame, a green floodplain continues as a band, and the white line of the embankment runs in front of it. The hills in the upper left remain dark green, and the difference in color shows that the spread of the town stops there.
If you move on to 1984-86, the whole frame sinks into the brown of winter. Much of the fields on the west side has been replaced by houses and roads, and the lots are cut more finely. Notice the north side of the yard, where bright lots with no lines start to mix into the surface that was filled with stripes until then. They are the marks of disused sidings that were removed. In the same frame a building with a large blue roof has been added toward the east, and renewal on the town side is also going on in parallel.
After the yard withdrew
The method of sorting freight trains car by car gave way to a method of running cars directly in groups. With the change in the transport method in the mid-1980s, the yard's role ended, and a long, narrow blank was left in the midst of the town. The vacated site went through land readjustment and was reorganized into a new urban area under the name Asuto Nagamachi.
The railway side changed too. In 1987 the Sendai Subway Namboku Line opened, and at Nagamachi it became possible to transfer between the Tohoku Line above ground and the Namboku Line below. The station of a freight-car town became a transfer station for people.
Because the former site had been held as a single block for a long time, there was a great deal of freedom in redrawing its lots. Placing the photographs side by side, you can see that while the surrounding town is being renewed little by little in fine lots, only the inside of the band has been replaced by large blocks and wide roads. The shape of the blank left inside the town directly decided the shape of the blocks that followed.
If you switch to today's photograph, the stripes that ran down the center have disappeared. The tracks are reduced to a few thin lines, and large box-shaped buildings and buildings whose tops appear a level higher than the surrounding roofs stand on their east side. The outlines of the blocks are straight, and wide roads divide the land like a grid. Sizable vacant lots and marked-out parking areas still remain here and there, and in places the land use does not yet seem settled. A round, bright surface also appears in one of the blocks from this era. On the other hand, some things have not moved since the old eras. The line of the highway through the center and the direction of the tracks, the course of the river in the northeast with the green of its floodplain, and the forest on the hill in the northwest are in nearly the same positions as in the 1945-50 photograph.
At a residential site in Nagamachi 4-chome, 405 m from this location, the record of official land prices (Chika Koji) continues. Per square meter, it fell from 135,000 yen in 1989, and 123,000 yen in 2005 and 2006 and in 2011 and 2012 was the lowest up to the 2026 official land prices; in 2026 it is 269,000 yen. The highest value in the record up to the 2026 official land prices thus falls in the last year, 2026. It is a shape that set a new ceiling after bottoming out, and you can read that the opening of the town on the former site showed up in the land price with a delay. Given the condition of the land, a low plain with almost no relief, the hazard map published by the City of Sendai gives the answer in map form for expected flooding.