Heiwajima / Oi Pier (Ryutsu Center) about 60 years ago and today
Then and now


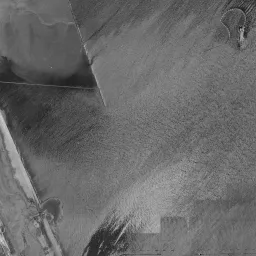


Nearby single photograph taken: June 26, 1963 (0.3 km from this spot)
What to compare in this era: Look for the straight seawall line drawn in the water surface and the patchy bare ground inside it. In the upper left, an oval course is drawn in two rings on the reclaimed area of the previous era
Controls: drag to move / right-drag to rotate and tilt / scroll while holding ⌘ or Ctrl to zoomControls: slide with two fingers to move / pinch to zoom / drag two fingers up or down to tilt
Note: the 3D elevation data is based on current surveys, not on the terrain at the time of the photograph. Elevation tiles: processed from GSI Tiles
The 3D view could not be loaded. Check your connection and try again.
Gray areas in the old photograph: Areas where no aerial photograph of this era is available (outside the area photographed, over the sea and the like).
Note: the terrain shading is based on current surveys, not on the terrain at the time of the photograph. Hillshade map: processed from GSI Tiles
Note: the map is today's, not a map from the time of the photograph. Map: © OpenStreetMap contributors
Source: processed from GSI Tiles (aerial photographs by era / aerial photographs by fiscal year / latest nationwide photographs / single photographs / survey periods of the photographs)
Explore this area on the mapMove the map to compare the surroundings then and now as well.
Overlay and compare the 1961-1969 aerial photograph and today's photograph of the Heiwajima / Oi Pier (Ryutsu Center) area, Tokyo. All photographs are published by the Geospatial Information Authority of Japan (GSI).
Eras of photographs for this location
For the Heiwajima / Oi Pier (Ryutsu Center) area, aerial photographs from the following eras can be compared.
The old photographs of this location cover 8 eras from c. 1936-1942 to FY2007; as of 2026, the newest photograph, FY2007, is 18-19 years ago.There are no photographs of this location from after that until today. The differences between eras are summarized in the guide to aerial photograph eras.
Coverage for each era differs by region. Only the eras that actually have photographs of this location are listed here.
Elevation of this location
The elevation (above sea level) near Ryutsu Center Station is 3.8 m (source: GSI elevation API). Elevation profiles running east-west and north-south through this location are also shown.
Profile positions (vertical green line = north-south / horizontal blue line = east-west)
Where the line in a profile breaks off and leaves a gap, no elevation data is available (water surfaces such as the sea or rivers).
Elevation is the value at the ground surface (even where a station is underground or elevated, the value is for the ground surface). Elevation is only one factor in disaster preparedness. Check actual risks such as flooding on the Hazard Map Portal Site and the hazard maps published by local governments.
Elevation tiles for the profiles: processed from GSI Tiles
Access by rail
Ryutsu Center Station is served by the following lines.
- Tokyo Monorail Haneda Airport Line
Source of line information: processed from National Land Numerical Information (Railway Data / Ministry of Land, Infrastructure, Transport and Tourism).
Change seen in the share of built-up area
This compares land use in 1976 and 2021. The share of built-up area within 500 m changed from 30% to 75%. Among the locations on this site, the spread of built-up area here is on the large side (top 20-40%). The bar below shows where this location falls in the distribution across the locations on this site.
Source: processed from National Land Numerical Information (Land Use Subdivision Mesh / 1976 and 2021 / Ministry of Land, Infrastructure, Transport and Tourism). The texture value (amount of fine detail) of the photographs changed from 11.7 to 41.4. This is a mechanical comparison between photographs and includes differences from the shooting season and from black and white versus color, so treat it only as a rough guide.
Official land prices over time
The official land price (Chika Koji) standard site nearest to this location is "3-207-4 Omori-kita, Ota Ward, Tokyo" (about 1.3 km in a straight line; use: Residential). The official prices per square meter at this standard site from 1991 to 2026 are shown below. The 2026 official price is 594,000 yen.
View as a table
| Year | Official price |
|---|---|
| 1991 | 1,240,000 yen |
| 1992 | 1,040,000 yen |
| 1993 | 812,000 yen |
| 1994 | 694,000 yen |
| 1995 | 666,000 yen |
| 1996 | 600,000 yen |
| 1997 | 545,000 yen |
| 1998 | 500,000 yen |
| 1999 | 457,000 yen |
| 2000 | 433,000 yen |
| 2001 | 414,000 yen |
| 2002 | 405,000 yen |
| 2003 | 395,000 yen |
| 2004 | 385,000 yen |
| 2005 | 383,000 yen |
| 2006 | 383,000 yen |
| 2007 | 414,000 yen |
| 2008 | 444,000 yen |
| 2009 | 412,000 yen |
| 2010 | 389,000 yen |
| 2011 | 384,000 yen |
| 2012 | 381,000 yen |
| 2013 | 381,000 yen |
| 2014 | 389,000 yen |
| 2015 | 396,000 yen |
| 2016 | 405,000 yen |
| 2017 | 415,000 yen |
| 2018 | 424,000 yen |
| 2019 | 441,000 yen |
| 2020 | 461,000 yen |
| 2021 | 460,000 yen |
| 2022 | 466,000 yen |
| 2023 | 482,000 yen |
| 2024 | 509,000 yen |
| 2025 | 549,000 yen |
| 2026 | 594,000 yen |
Source: processed from National Land Numerical Information (Land Price Publication Data / Ministry of Land, Infrastructure, Transport and Tourism). Official land prices are values published for standard sites as of January 1 each year and do not show the transaction price of any particular piece of land. The selection and location of standard sites may be reviewed from year to year.
Nearby locations
Sorted by distance from Heiwajima / Oi Pier. Comparing them together shows how the same area has changed over time.
Select a marker on the map to see the location name and a link to it.
Locations with the same origins
Towns in the same category as Heiwajima / Oi Pier (Reclaimed land), chosen from other regions. You can compare what they share in land use and town layout.
Select a marker on the map to see the location name and a link to it.
Articles that feature this location
60 years of the Tokyo Bay shore: the changing purposes of reclamation
How an artificial island differs from reclaimed land: photographs of Port Island, Daiba, and others
Aerial photographs from 1974-78: what stage of grading is Tama Center at?
Trace the old names: towns on the day their district names changed
Recently viewed towns
This history is saved only on your device and is not sent to any server. Depending on your browser settings, it may be deleted automatically if you do not visit for a while (it is less likely to be deleted if you use the site as an app).
Why not look at how another town has changed?
History of Heiwajima / Oi Pier (Ryutsu Center)
The area from Heiwajima to Oi Pier is land where, if you advance through the eras of aerial photographs in order from the oldest, the process of sea turning into land appears in sequence just as it happened. Eight past eras remain, from c. 1936-42 to FY2007. However, for the oldest, c. 1936-42, there is no photograph at all directly over the location, and it is from 1945-50 that the ground underfoot can be confirmed as water. Seawalls and bare ground appear in 1961-69, and by 1974-78 a large building sits directly on the location. In descriptions of reclaimed land, the scene of becoming land often falls between the last past era and the latest photograph. Here the order from water to town fits entirely within the eight eras.
Because the port of Tokyo opened at the mouth of the Sumida River, it lacked both deep quays where large ships could berth and wide flat land for handling cargo. Filling in the shallow sea offshore near central Tokyo would provide both at once. This area is land born from that idea, and the elevation at the location is 3.8 m at the center, 4.2 m to the north, 4.1 m to the south and 7.6 m to the west. There is no value for the east. The cross-section graph breaks off to the east because that direction is the water surface of a canal, and the source elevation data has not been made for it. The sequence with almost no relief from north to south and only the west one step higher shows that the location is placed on land developed flat. The nearest station is Ryutsu Center Station on the Tokyo Monorail Haneda Line, and the station's name, which means distribution center, expresses directly the role given to this land.
The offshore area the photographs do not reach
In the c. 1936-42 photograph, the area that has an image is itself narrow. Only a band toward the left of the frame appears; its width is narrowest at about 20% of the height from the top and reaches about 40% of the frame near the bottom edge. The rest is pale gray, the area the photography did not reach. There is no photograph at all directly over the location, and nothing can be said about the ground underfoot from this era. In the band you can see a city area pressed to the left edge and the dark water surface spreading east of it. Quays and jetties lie above the city area, with fine rows of buildings inside them, and the straight lines of roads and a railway run vertically. Toward the lower left there is a square corner enclosed by seawalls, with a group of buildings that look like factories on it. South of it a single white round structure is placed. Along the very top edge and the bottom edge there are bands spliced from other shoots, with handwritten numbers and white lettering remaining, so the history of the material as a record is visible just as it is.
In the 1945-50 photograph, the gray surface shifts to the right side of the frame. From the top edge down to about 70% of the height, about 30% of the width is gray, and the left edge of the gray shifts further left the lower it goes. There is no gray in the bottom quarter. The monochrome frame is grainy, but it is clear that most of the area shown is dark water surface. The left edge is a city area of a dense grid, and above it there is a large bright reclaimed area separated by a river or an inlet. Toward the left, long, narrow islets and small structures line up vertically, and a bright, irregular shape that looks like a sandbar floats east of them. In the lower left there is a peninsula-shaped corner with buildings on it, and the area to its south is a city area of a grid. At the bottom edge too, one long, narrow bright island appears. Directly at the location and around it, there is not a single artificial straight line.
Bare ground enclosed by seawalls
In the 1961-69 photograph, the left half of the frame turns into different land. A straight seawall line is drawn in the water surface, and the flat bare ground inside it continues south as a diagonal band. The surface has patches of light and dark, showing that the piled-up soil has not yet been leveled. In the upper left corner a racecourse appears, drawing an oval course in two rings. The facility has been placed on top of the bright reclaimed area that was at this position in the 1945-50 photograph, and going back and forth between the two eras lets you read the order in which the land use was decided. In the lower left there are a group of buildings that look like factories and two white round storage tanks. The composite image is bright only on the right side, and the seam between photographs taken separately can be seen. The location sits around the border between the eastern edge of the reclaimed land and the water surface outside it.
An island filled with warehouses
The 1974-78 photograph has color, and the sequence of the development can be read at a glance. The racecourse with a green interior lies in the upper left, the large roofs of long, narrow warehouses are lined up in the center left, and a large white box-shaped building stands south of them. The location is right on top of this building, a place that was the water's edge in the previous era. The frame from the center to the right is an expanse of ocher bare ground, with only lot lines and wide roads drawn, and leftover green puddles that were not filled in. In the upper right a corner can be seen where many thin straight lines are bundled together. It is a yard for lining up freight trains; Tokyo Freight Terminal Station opened in 1973, and this bundle corresponds to its group of tracks. A green canal crosses diagonally below the center.
The 1979-83 photograph has faded tones overall, and the skeleton is almost the same as in the previous era. The change is in the color of the bare ground: over a wide area of the right half, grass has grown and turned it from brown to dark brown, and divided green spaces and a square flat area that looks like a sports ground appear. In the center left the row of warehouses extends further, and the canal water is muddied ocher. The contrast between these two eras shows well that land created by filling is not all used right away, and that there is a period when it is left as vacant land overgrown with grass.
Reclaimed land where a market came
The 1984-86 photograph falls in the season of withered grass, and the right half is uniformly brown. The bundle of tracks in the upper right has increased further, and south of it four to five large white roofs line up. In the center left, long buildings with gray roofs are lined up, and the location is on the group of large flat roofs south of them. The canal is a deep navy blue, and in the middle right there is a green puddle left over from the previous era.
In the 1987-90 photograph, a group of large buildings with white sawtooth roofs appears in the middle right. It is Ota Market, which opened in 1989, and the facilities of the wholesale market appear as a chain of wide roofs. Green spaces and ponds are placed around it, and a row of large gray roofs has also been added beside the bundle of tracks in the upper right. In the lower right of the center a white elevated road runs diagonally, and several bridges cross the canal. If you compare it with the bare ground of 1974-78, you can see that the vacant land filled up in about 20 years. A large building with a gray flat roof stands directly at the location, the building from the previous era remaining as it was.
Even if you switch to the latest photograph, the skeleton of this land has not moved. The position of the canal, the oval of the racecourse, the bundle of tracks, the large roofs of the market and the warehouses in the center left are all in the same places as in 1987-90. The change is in the roofs: the warehouse roofs have changed to white and bluish colors, and blue surfaces that look like solar power equipment sit on the large flat roofs. In Tennozu to the north, the warehouse district was rearranged into blocks of offices and housing, but this area has kept its role as land for logistics and a market up to today. Land whose lots and seawalls were decided first to suit its use is hard to change in outline once buildings sit on it.
There is no residential point for official land prices (Chika Koji) inside the reclaimed land, and the nearest reference point is in Omori-kita, Ota Ward, about 1.3 km to the southwest. The price per square meter is 1,240,000 yen in 1991, when the record begins. The bottom up to the 2026 publication is 381,000 yen in 2012 and 2013, below one third of 1991. In the 2026 official land prices it is 594,000 yen, 1.6 times 2012 and 2013, and still only just over 40% of the 1991 value. The reference point is a residential area on the mainland side across the canal, not the price of the reclaimed land itself. Ota Ward's hazard map shows the extent of assumed disasters divided by zone.