Old aerial photographs and today in Tokyo
Select a marker on the map to check the old aerial photograph of that location right there.
-
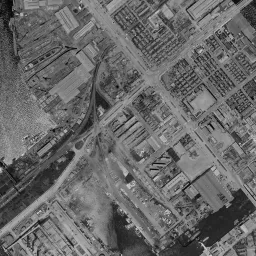 Toyosu
Tokyo / 1961-1969
-
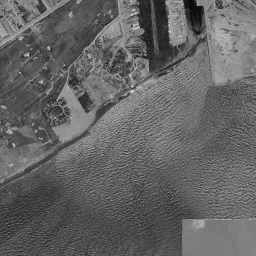 Ariake
Tokyo / 1961-1969
-
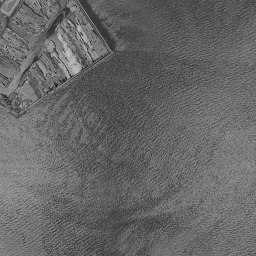 Daiba
Tokyo / 1961-1969
-
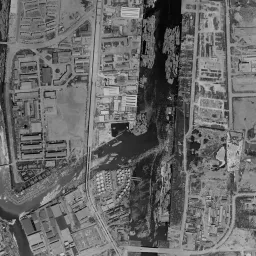 Tennozu
Tokyo / 1961-1969
-
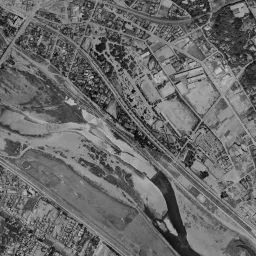 Futako-Tamagawa
Tokyo / 1961-1969
-
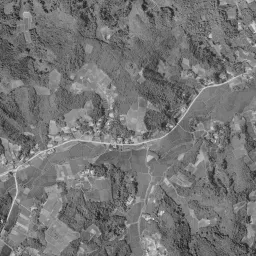 Tama New Town (Tama Center)
Tokyo / 1961-1969
-
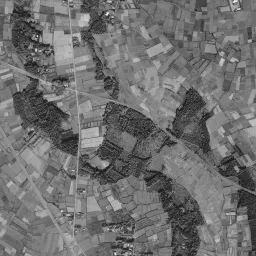 Minami-Machida Grandberry Park
Tokyo / 1961-1969
-
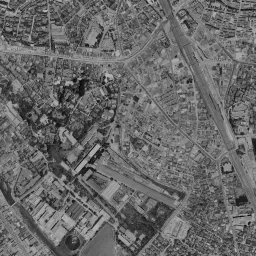 Yebisu Garden Place
Tokyo / 1961-1969
-
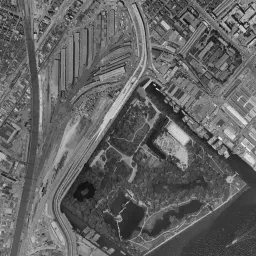 Shiodome Sio-Site
Tokyo / 1961-1969
-
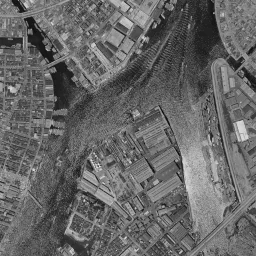 Okawabata River City 21
Tokyo / 1961-1969
-
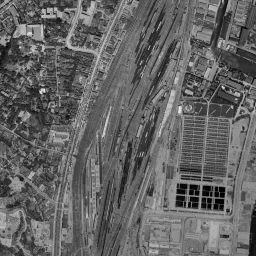 Takanawa Gateway City
Tokyo / 1961-1969
-
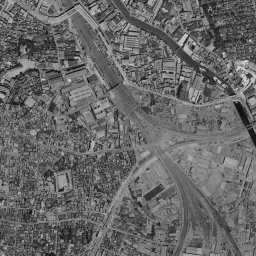 Osaki Garden City
Tokyo / 1961-1969
-
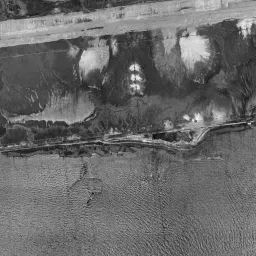 Yumenoshima / Shinkiba
Tokyo / 1961-1969
-
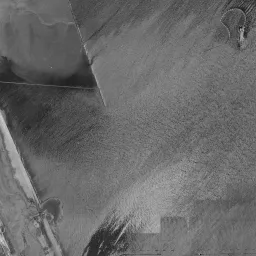 Heiwajima / Oi Pier (Ryutsu Center)
Tokyo / 1961-1969
-
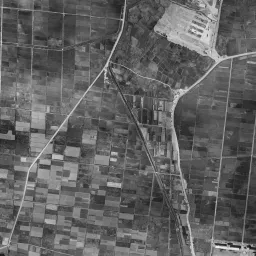 Takashimadaira Danchi
Tokyo / 1961-1969
-
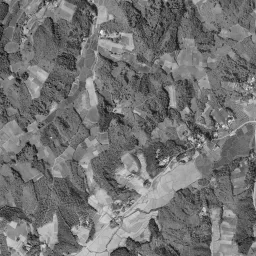 Tama New Town Minami-Osawa
Tokyo / 1961-1969
-
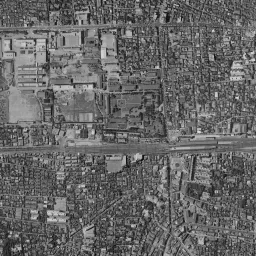 Nakano (Former National Police Academy)
Tokyo / 1961-1969
-
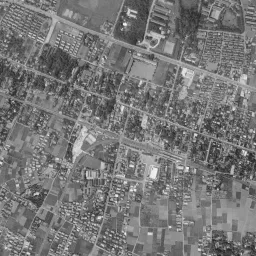 Chofu Station Area
Tokyo / 1961-1969
-
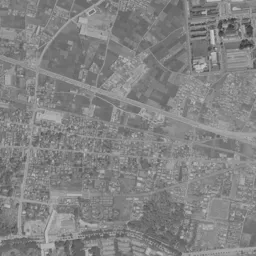 Fuchu (Former US Military Base)
Tokyo / 1961-1969
-
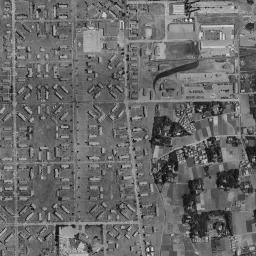 Hikarigaoka (Former Grant Heights)
Tokyo / 1961-1969
-
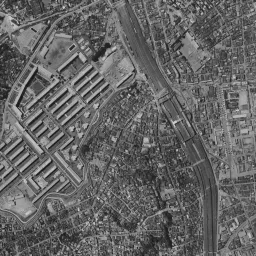 Akabane (Akabanedai Danchi)
Tokyo / 1961-1969
-
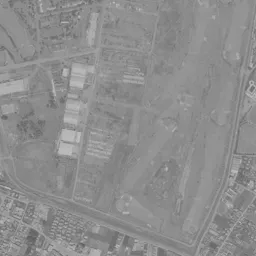 Akishima (Former Airfield)
Tokyo / 1961-1969
-
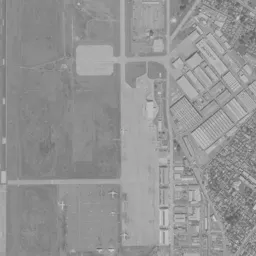 Tachikawa (Former Tachikawa Airfield)
Tokyo / 1961-1969
-
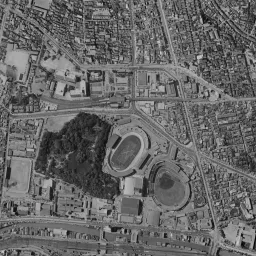 Suidobashi (Former Army Arsenal)
Tokyo / 1961-1969
-
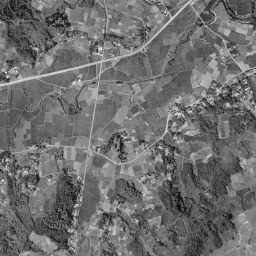 Tama New Town (Keio-horinouchi)
Tokyo / 1961-1969
-
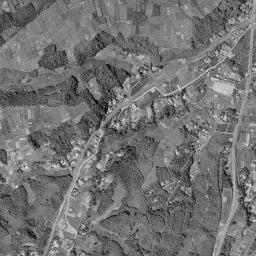 Hachioji-Minamino (Minamino City)
Tokyo / 1961-1969
Photographs by era
- c. 1936-1942: Toyosu / Ariake / Daiba / Tennozu / Futako-Tamagawa / Yebisu Garden Place / Shiodome Sio-Site / Okawabata River City 21 / Takanawa Gateway City / Osaki Garden City / Yumenoshima / Shinkiba / Heiwajima / Oi Pier (Ryutsu Center) / Takashimadaira Danchi / Nakano (Former National Police Academy) / Hikarigaoka (Former Grant Heights) / Akabane (Akabanedai Danchi) / Suidobashi (Former Army Arsenal)
- 1945-1950: Toyosu / Ariake / Daiba / Tennozu / Futako-Tamagawa / Yebisu Garden Place / Shiodome Sio-Site / Okawabata River City 21 / Takanawa Gateway City / Osaki Garden City / Yumenoshima / Shinkiba / Heiwajima / Oi Pier (Ryutsu Center) / Takashimadaira Danchi / Nakano (Former National Police Academy) / Chofu Station Area / Hikarigaoka (Former Grant Heights) / Akabane (Akabanedai Danchi) / Suidobashi (Former Army Arsenal)
- 1961-1969: Toyosu / Ariake / Daiba / Tennozu / Futako-Tamagawa / Tama New Town (Tama Center) / Minami-Machida Grandberry Park / Yebisu Garden Place / Shiodome Sio-Site / Okawabata River City 21 / Takanawa Gateway City / Osaki Garden City / Yumenoshima / Shinkiba / Heiwajima / Oi Pier (Ryutsu Center) / Takashimadaira Danchi / Tama New Town Minami-Osawa / Nakano (Former National Police Academy) / Chofu Station Area / Fuchu (Former US Military Base) / Hikarigaoka (Former Grant Heights) / Akabane (Akabanedai Danchi) / Akishima (Former Airfield) / Tachikawa (Former Tachikawa Airfield) / Suidobashi (Former Army Arsenal) / Tama New Town (Keio-horinouchi) / Hachioji-Minamino (Minamino City)
- 1974-1978: Toyosu / Ariake / Daiba / Tennozu / Futako-Tamagawa / Tama New Town (Tama Center) / Minami-Machida Grandberry Park / Yebisu Garden Place / Shiodome Sio-Site / Okawabata River City 21 / Takanawa Gateway City / Osaki Garden City / Yumenoshima / Shinkiba / Heiwajima / Oi Pier (Ryutsu Center) / Takashimadaira Danchi / Tama New Town Minami-Osawa / Nakano (Former National Police Academy) / Chofu Station Area / Fuchu (Former US Military Base) / Hikarigaoka (Former Grant Heights) / Akabane (Akabanedai Danchi) / Akishima (Former Airfield) / Tachikawa (Former Tachikawa Airfield) / Suidobashi (Former Army Arsenal) / Tama New Town (Keio-horinouchi) / Hachioji-Minamino (Minamino City)
- 1979-1983: Toyosu / Ariake / Daiba / Tennozu / Futako-Tamagawa / Tama New Town (Tama Center) / Minami-Machida Grandberry Park / Yebisu Garden Place / Shiodome Sio-Site / Okawabata River City 21 / Takanawa Gateway City / Osaki Garden City / Yumenoshima / Shinkiba / Heiwajima / Oi Pier (Ryutsu Center) / Takashimadaira Danchi / Tama New Town Minami-Osawa / Nakano (Former National Police Academy) / Chofu Station Area / Fuchu (Former US Military Base) / Hikarigaoka (Former Grant Heights) / Akabane (Akabanedai Danchi) / Akishima (Former Airfield) / Tachikawa (Former Tachikawa Airfield) / Suidobashi (Former Army Arsenal) / Tama New Town (Keio-horinouchi) / Hachioji-Minamino (Minamino City)
- 1984-1986: Toyosu / Ariake / Daiba / Tennozu / Futako-Tamagawa / Tama New Town (Tama Center) / Minami-Machida Grandberry Park / Yebisu Garden Place / Shiodome Sio-Site / Okawabata River City 21 / Takanawa Gateway City / Osaki Garden City / Yumenoshima / Shinkiba / Heiwajima / Oi Pier (Ryutsu Center) / Takashimadaira Danchi / Tama New Town Minami-Osawa / Nakano (Former National Police Academy) / Chofu Station Area / Fuchu (Former US Military Base) / Hikarigaoka (Former Grant Heights) / Akabane (Akabanedai Danchi) / Akishima (Former Airfield) / Tachikawa (Former Tachikawa Airfield) / Suidobashi (Former Army Arsenal) / Tama New Town (Keio-horinouchi) / Hachioji-Minamino (Minamino City)
- 1987-1990: Toyosu / Ariake / Daiba / Tennozu / Futako-Tamagawa / Tama New Town (Tama Center) / Minami-Machida Grandberry Park / Yebisu Garden Place / Shiodome Sio-Site / Okawabata River City 21 / Takanawa Gateway City / Osaki Garden City / Yumenoshima / Shinkiba / Heiwajima / Oi Pier (Ryutsu Center) / Takashimadaira Danchi / Tama New Town Minami-Osawa / Nakano (Former National Police Academy) / Chofu Station Area / Fuchu (Former US Military Base) / Hikarigaoka (Former Grant Heights) / Akabane (Akabanedai Danchi) / Akishima (Former Airfield) / Tachikawa (Former Tachikawa Airfield) / Suidobashi (Former Army Arsenal) / Tama New Town (Keio-horinouchi) / Hachioji-Minamino (Minamino City)
- FY2007: Heiwajima / Oi Pier (Ryutsu Center) / Takashimadaira Danchi / Hikarigaoka (Former Grant Heights) / Akabane (Akabanedai Danchi)
Station areas in this prefecture that became most built up (top 10)
Ranked by how much the share of built-up area within 500 m of each station grew from 1976 to 2021. The national ranking is in Station areas that became most built up in 45 years.
Urban area share (top: 1976, bottom: 2021)
-
1
Minami-Osawa StationKeio Sagamihara Line
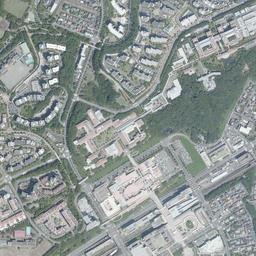
- 1 Ozaku StationJR East Ome Line
- 3 Keio-tama-center StationKeio Sagamihara Line
-
3
Tama-Center StationTama Toshi Monorail Line
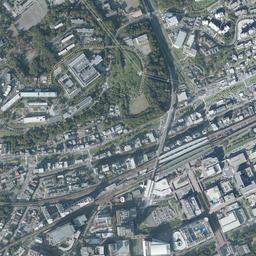
- 5 Kabe StationJR East Ome Line
- 5 Mizue StationToei Shinjuku Line
- 7 Odakyu Tama-Center StationOdakyu Electric Railway Tama Line
- 7 Sakura-kaido StationTama Toshi Monorail Line
- 9 Nishi-kasai StationTokyo Metro Tozai Line
-
10
Minami-machida Grandberry Park StationTokyu Den-en-toshi Line
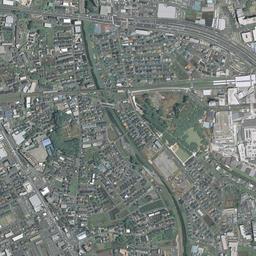
Source: processed from National Land Numerical Information (Land Use Subdivision Mesh / Railway Data / Administrative Boundaries / Ministry of Land, Infrastructure, Transport and Tourism) / Photographs: GSI Tiles (aerial photographs by era / latest nationwide photographs)
See old and today's aerial photographs anywhere in Tokyo on the map