Shiodome Sio-Site about 60 years ago and today
Then and now


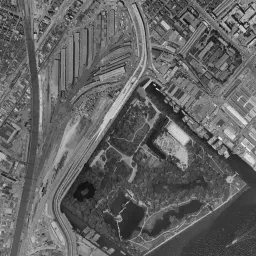


Nearby single photograph taken: June 29, 1966 (0.1 km from this spot)
What to compare in this era:
Controls: drag to move / right-drag to rotate and tilt / scroll while holding ⌘ or Ctrl to zoomControls: slide with two fingers to move / pinch to zoom / drag two fingers up or down to tilt
Note: the 3D elevation data is based on current surveys, not on the terrain at the time of the photograph. Elevation tiles: processed from GSI Tiles
The 3D view could not be loaded. Check your connection and try again.
Note: the terrain shading is based on current surveys, not on the terrain at the time of the photograph. Hillshade map: processed from GSI Tiles
Note: the map is today's, not a map from the time of the photograph. Map: © OpenStreetMap contributors
Source: processed from GSI Tiles (aerial photographs by era / latest nationwide photographs / single photographs)
Explore this area on the mapMove the map to compare the surroundings then and now as well.
Overlay and compare the 1961-1969 aerial photograph and today's photograph of the Shiodome Sio-Site area, Tokyo. All photographs are published by the Geospatial Information Authority of Japan (GSI).
Eras of photographs for this location
For the Shiodome Sio-Site area, aerial photographs from the following eras can be compared.
The old photographs of this location cover 7 eras from c. 1936-1942 to 1987-1990; as of 2026, the newest photograph, 1987-1990, is 37 years ago.There are no photographs of this location from after that until today. The differences between eras are summarized in the guide to aerial photograph eras.
Coverage for each era differs by region. Only the eras that actually have photographs of this location are listed here.
Elevation of this location
The elevation (above sea level) near Shimbashi Station is 3.8 m (source: GSI elevation API). Elevation profiles running east-west and north-south through this location are also shown.
Profile positions (vertical green line = north-south / horizontal blue line = east-west)
Elevation is the value at the ground surface (even where a station is underground or elevated, the value is for the ground surface). Elevation is only one factor in disaster preparedness. Check actual risks such as flooding on the Hazard Map Portal Site and the hazard maps published by local governments.
Elevation tiles for the profiles: processed from GSI Tiles
Access by rail
Shimbashi Station is served by the following lines.
- Yurikamome Line
- Tokyo Metro Ginza Line
- Toei Asakusa Line
- JR East Tokaido Line
Source of line information: processed from National Land Numerical Information (Railway Data / Ministry of Land, Infrastructure, Transport and Tourism).
Change seen in the share of built-up area
This compares land use in 1976 and 2021. The share of built-up area within 500 m changed from 100% to 100%. Among the locations on this site, the spread of built-up area here is among the smallest (bottom 20%). The bar below shows where this location falls in the distribution across the locations on this site.
Source: processed from National Land Numerical Information (Land Use Subdivision Mesh / 1976 and 2021 / Ministry of Land, Infrastructure, Transport and Tourism). The texture value (amount of fine detail) of the photographs changed from 17.9 to 32.6. This is a mechanical comparison between photographs and includes differences from the shooting season and from black and white versus color, so treat it only as a rough guide.
Official land prices over time
The official land price (Chika Koji) standard site nearest to this location is "1-1424-1 Akasaka, Minato Ward, Tokyo" (about 1.5 km in a straight line; use: Residential). The official prices per square meter at this standard site from 2002 to 2026 are shown below. The 2026 official price is 7,110,000 yen.
View as a table
| Year | Official price |
|---|---|
| 2002 | 1,780,000 yen |
| 2003 | 1,780,000 yen |
| 2004 | 1,780,000 yen |
| 2005 | 1,800,000 yen |
| 2006 | 2,110,000 yen |
| 2007 | 2,750,000 yen |
| 2008 | 3,300,000 yen |
| 2009 | 2,800,000 yen |
| 2010 | 2,580,000 yen |
| 2011 | 2,470,000 yen |
| 2012 | 2,440,000 yen |
| 2013 | 2,440,000 yen |
| 2014 | 2,680,000 yen |
| 2015 | 2,970,000 yen |
| 2016 | 3,350,000 yen |
| 2017 | 3,680,000 yen |
| 2018 | 4,010,000 yen |
| 2019 | 4,340,000 yen |
| 2020 | 4,720,000 yen |
| 2021 | 4,840,000 yen |
| 2022 | 5,000,000 yen |
| 2023 | 5,120,000 yen |
| 2024 | 5,350,000 yen |
| 2025 | 5,900,000 yen |
| 2026 | 7,110,000 yen |
Source: processed from National Land Numerical Information (Land Price Publication Data / Ministry of Land, Infrastructure, Transport and Tourism). Official land prices are values published for standard sites as of January 1 each year and do not show the transaction price of any particular piece of land. The selection and location of standard sites may be reviewed from year to year.
Nearby locations
Sorted by distance from Shiodome Sio-Site. Comparing them together shows how the same area has changed over time.
Select a marker on the map to see the location name and a link to it.
Locations with the same origins
Towns in the same category as Shiodome Sio-Site (Former factory site), chosen from other regions. You can compare what they share in land use and town layout.
Select a marker on the map to see the location name and a link to it.
Articles that feature this location
Recently viewed towns
This history is saved only on your device and is not sent to any server. Depending on your browser settings, it may be deleted automatically if you do not visit for a while (it is less likely to be deleted if you use the site as an app).
Why not look at how another town has changed?
History of Shiodome Sio-Site
This block is land that has piled up many completely different faces. The sea of Edo is at the very bottom, and reclaimed ground, the residences of feudal lords, the starting point of Japan's first railway, a freight station, vacant land, and blocks of skyscrapers sit on top of it in order. The place name Shiodome (the name means tide stop) is said to come from a weir that held back sea water and from a river that flowed bearing that name. The elevation is 3.8 m at the center of the location and only 2.5 m at the western measuring point. Toward the north it rises to 4.8 m. The row of these values shows that this is land made by leveling what was the sea surface into dry land.
The town planning of Edo placed the residences of feudal lords in this area. The fact that wide lots facing the sea were gathered together took effect in the next era. In 1872, when Japan's first railway opened between Shimbashi Station and Yokohama Station, Shimbashi Station, which became its starting point, was built on the former site of these residences. It was close to the port, a large piece of flat land could be obtained, and cargo carried by ship could be loaded directly onto the railway. The reason the railway's first station was placed here can be almost fully explained by the terrain and the distance to the sea.
A station that became freight-only
The role changed in 1914. Tokyo Station opened and the handling of passengers moved there, and this yard became Shiodome Station, for freight only. The name Shimbashi as a passenger station was taken over by another station just to the west, Karasumori Station. Only the name moved, and the bundle of tracks remained in its original place. From then on, for more than 70 years, this place kept working as the entrance for bringing cargo into the city center.
In the photograph from around 1936-42, a surface where dozens of thin lines run in parallel spreads from Shimbashi Station east toward the sea side. Long, narrow transit sheds with roofs are set between the lines, and buildings that handle cargo firm up the edges. Because the townscape around it is a cluster of low roofs, the artificial straight lines of this surface stand out well.
If you switch to 1945-50, the look of the surroundings changes. In the air raids of 1945 a wide area of Tokyo burned, and this vicinity was also damaged. In the burned town area the density of buildings dropped, and only the division of blocks remains as lines. By contrast, the surface of tracks in the yard has hardly lost its form. It is an era in which things that break easily and things that do not are seen separately within the same frame.
The 1961-69 photograph, used as the basis for comparison, coincides with the period when this place was busiest. The surface of tracks is filled to its edges, and in many places the lines look thick with rows of freight cars. Around this era, the river that also gave the place name its origin was filled in and the elevated structure of an expressway was put through, so a waterway was replaced by a road for cars. The lines that had set the edges of the land were being rerouted.
In 1974-78 and 1979-83, the height of the surrounding buildings goes up. The town strengthens its character as a business district, and the colors and shapes of the roofs change. Meanwhile, the yard is in a period when, although the number of tracks is large, the unused tracks increase. The transfer of cargo was moving to trucks, and the method of rearranging freight cars one by one had itself stopped paying.
Transshipment as a weakness
For a long time, cargo going to shops and businesses in the city center was carried here by rail, transferred to small vehicles in the yard, and went out into the town. Once it became possible to skip that transfer and carry goods in one vehicle from origin to destination, the reason to go through a station in the city center faded. As roads extended and shippers also came to demand specified delivery times, the method of rearranging freight cars lost on speed. In 1984, Japanese National Railways ended the transport system built around rearranging freight cars. Little work remained for Shiodome Station, and it was abolished in 1986. In the center of Tokyo, a single open space of about 30 hectares was born.
The 1987-90 photograph coincides exactly with that blank period. The tracks and transit sheds have disappeared, and a surface of bare ground appears in the frame. Even in the city center, a plan to use up this much area at once does not get moving right away. Coinciding with the period when land values were at their highest was also one cause of the indecision. This photograph preserves a state that lasted only a few years in the history of the town.
The first layer under the lid
Among the events of the blank period, the excavation shows the character of this land well. In surveys in the 1990s, the foundations of the station building and platform from the opening were found under the ground. While tracks and transit sheds occupied the surface, the ground below had escaped being dug up on a large scale. The years as a freight station themselves served as a lid protecting the first layer. The remains became a national Historic Site in 1996, and in 2003 the exterior of the station building at the opening was restored and opened as an exhibition facility standing over the remains. The zero-mile marker showing the starting point of the railway can also be seen there.
A block where transport came first
In the order in which it rose as a town, transport came first. In 1995 a new transit system starting at Shimbashi Station and heading for the waterfront opened, and an elevated structure came to pass beside the former site. It was in 2002 that a subway station opened in this block. Skyscraper office towers were completed one after another from 2002 to 2003, the head offices of a broadcaster and an advertising company moved in, and the blocks were named Shiodome Sio-Site. The time as vacant land ended after a little more than 15 years.
In the photograph as of 2026, streets are drawn to match the direction in which the tracks once lined up, and tall buildings are packed in on both sides. The surface of lines that once colored the ground in a single tone has been replaced by a grid of building roofs and shadows. The mean pixel difference calculated by overlaying the 1961-69 image and the image as of 2026 is 24.6, and the texture value has increased from 17.9 to 32.6. The change of a flat surface into a three-dimensional one becomes the difference in the numbers just as it is.
The reference point for land values is the series of residential land in Akasaka 1-chome, about 1.5 km away. From 1,780,000 yen per square meter in 2002 it jumped to 3,300,000 yen in 2008, fell to 2,440,000 yen in 2012-13, and then reached 7,110,000 yen in the official land prices (Chika Koji) of 2026. It is a trend of about four times from 2002 to the 2026 official land prices, and it coincides with the period when business districts in the city center increased.